
Yarn Evenness: Uster Statistics


Uster Statistics is the global benchmark for yarn evenness quality, with the 2025 edition reporting that ring-spun combed cotton at 30 Ne averages a CVm of 12.5%, 12 thin places (50% lower mass per kilometer), and 25 neps (200% higher mass per kilometer), while open-end rotor yarns at the same count average a CVm of 14.1% with 18 thick places (50% higher mass per kilometer) per kilometer.
These percentile-based reference values, first published by Uster Technologies in 1957 and now refreshed on a five-year cycle, let mills grade ring, rotor, air-jet, and compact yarns against the world median and the world tails.
This article walks through what the statistics measure, how the tables are read, and why they still matter in modern spinning rooms.
What Yarn Evenness Means and Why Mills Measure It
Yarn evenness describes how uniform a yarn’s linear density (mass per unit length) is along its length. Real spun yarn is never perfectly uniform: drafting waves, fiber fly, splice defects, and roller slippage all introduce short-, medium-, and long-term variation. Uneven yarn shows up downstream as fabric barre, dye streaks, irregular hand, and reduced tensile strength, so most spinning mills measure it on every machine, every shift.
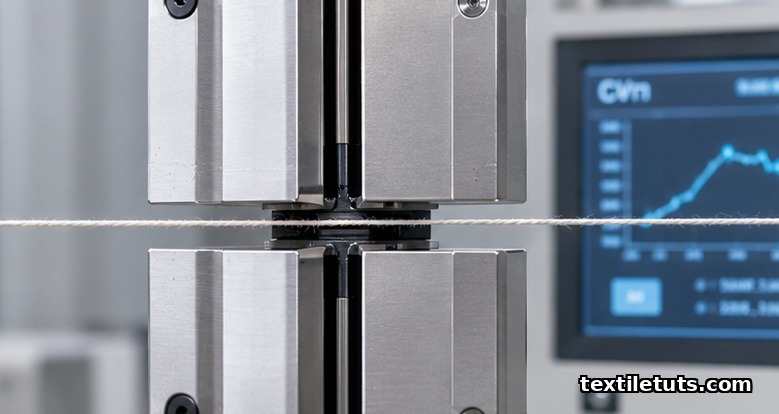
The dominant instrument is the Uster Tester, a capacitive sensor that passes yarn through a parallel-plate electric field. Variations in mass change the capacitance, which the instrument converts into a continuous mass trace. From that trace the tester derives the coefficients of variation (CV%) and the count of thin places, thick places, and neps over a measured length, all standardized against ASTM D1425/D1425M-14 and ISO 16549.
A Short History of Uster Statistics
Uster Technologies (formerly Zellweger Uster) released the first Uster Statistics bulletin in 1957, gathering evenness data from hundreds of mills worldwide into a single percentile distribution. The intent was practical: a mill running 30 Ne ring yarn could compare its own CVm against the world median, the 25th percentile, the 75th percentile, and the 95th percentile to see whether it was at, above, or below the global norm.
The bulletin has been republished at roughly five-year intervals, with major revisions in 1997, 2007, 2013, 2018, and 2025. Each edition reflects changes in machine technology: the 1997 edition first included open-end rotor yarns at scale, the 2007 edition added compact-spun and air-jet yarns, and the 2018 edition broadened its coverage of man-made fiber blends. The 2025 edition continues this approach, drawing on tens of millions of measured kilometers of yarn contributed by mills across the major spinning regions.
The Parameters a Spinner Reads
Every Uster Statistics table is built around a fixed parameter set. The values printed for each yarn count and spinning system are typically the 5%, 25%, 50%, 75%, and 95% percentiles, so a mill knows not only the median but also the tails of the world distribution.
The headline number is CVm, the coefficient of variation of mass over the standard test length at a feed rate of 100 m/min, calculated as 100 times the standard deviation divided by the mean. Shorter-wavelength variation is reported as CV1m and CV3m, which suppress long-term draft errors and isolate short-term roller slip and drafting-wave effects. CV10m captures long-term variation and is sensitive to roving and creel defects.
Defect counts follow ISO 16549 definitions: thin places are segments with at least 50% lower mass than the running average, thick places are at least 50% higher, and neps are at least 200% higher, each counted per kilometer. The 200% threshold for neps is the formal boundary between an extra-thick mass concentration and a true spinning defect, since cotton neps originate from immature or dead fibers that survive carding and drafting.
Most editions also include hairiness (the H value, the total length of fibers protruding from a yarn segment, expressed as a multiple of the yarn length) and, in newer editions, yarn tenacity and elongation CV.
How to Read an Uster Statistics Table
Tables are sorted by yarn count and spinning system. For 30 Ne combed ring-spun cotton, the 2025 median values are roughly CVm 12.5%, thin places 12 per kilometer, thick places 35 per kilometer, and neps 25 per kilometer. A 25th-percentile mill runs CVm around 11.3%; a 95th-percentile mill may be above 14.5%.
If your lab reports CVm 13.2% on the same count, you sit between the 25th and 50th percentile, meaning you are average to slightly above average globally. If CVm is 15.0%, you are at roughly the 75th percentile, which on a percentile table means about three quarters of the world’s mills are better than you on this parameter, a signal that drafting, comber, or roving preparation needs review.
The standard interpretation rule is that the percentile rank describes the world distribution, not the quality target. Most commercial buyers specify a CVm ceiling, often 13.5% for 30 Ne combed cotton weft, so the 75th percentile is acceptable while the 95th percentile is out of spec.
Spinning Technology Comparison in the Same Edition
One of the most-cited uses of Uster Statistics is comparing yarn structures. For the same nominal count, the 2025 edition reports median CVm of 12.5% for ring-spun combed cotton, 14.1% for rotor-spun, 13.8% for air-jet, and 12.2% for compact-spun. Rotor yarns run higher CVm because rotor geometry cannot fully compensate for short-fiber drafting waves, but rotor yarns also have fewer neps and no roving-twist issues. Air-jet yarns sit between ring and rotor in CVm but show different wavelength spectra because of their air-vortex structure. Compact yarns come in below ring-spun CVm because the suction condensing zone suppresses fiber fly and edge fibers.
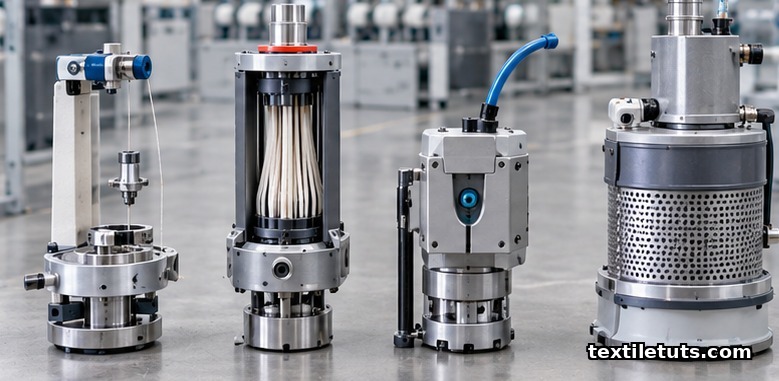
These differences matter when a mill switches customer or end-use. A knitting mill buying 30 Ne yarn for jersey tolerates higher CVm than a fine-denier weaving mill buying the same count for shirting, because knit loops mask short-term variation while weave sett exposes it.
Application in Routine Quality Control
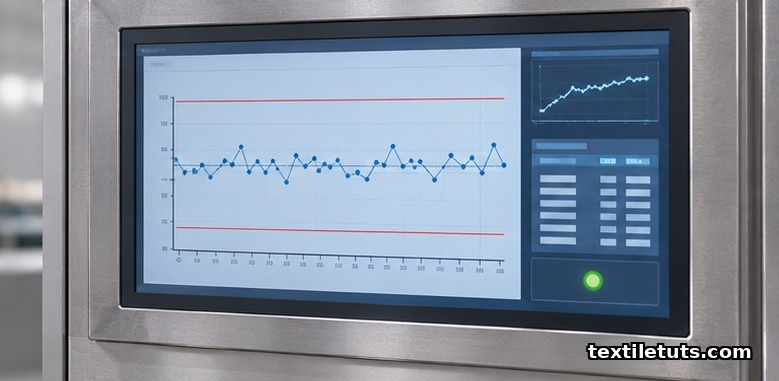
Most mills log Uster Tester output into a Statistical Process Control (SPC) chart and set control limits at plus or minus two standard deviations around a baseline that is itself calibrated to the relevant percentile of Uster Statistics. A CVm shift of more than 0.5 percentage points between shifts, or an increase in thin places of more than 30% in 24 hours, triggers a stop-and-investigate on the upstream machine.
Standards referenced in QC documents include ASTM D1425/D1425M-14 for the capacitance test method, ISO 16549 for thin, thick, and nep definitions, and ASTM D2255 for yarn appearance grading, which complements the numerical Uster data with a visual assessment of yarn boards against standard photo plates.
For inter-mill benchmarking, the Uster Statistics bulletin is the only globally accepted reference. A Bangladesh spinner comparing its 30 Ne combed yarn to a Turkish spinner comparing the same count to a Brazilian spinner are all reading the same percentile lines from the same edition, which is the entire reason the publication exists.
Limitations and Modern Context
Uster Statistics was built around ring-spun cotton, and the median values in the bulletin are most representative for that system. The document has expanded coverage over the decades, but mills spinning filament polyester, spandex core-spun, or high-tenacity technical yarns find that the bulletin is descriptive rather than normative for those products.
Optical yarn profilers, online evenness sensors on ring frames, and machine-learning defect classifiers now generate per-shift big-data streams that go beyond what the percentile tables can capture. Uster Statistics remains the reference framework, but the actual production decision today is often driven by these per-machine dashboards, with the bulletin as the calibration anchor.
For students and newcomers to spinning, the bulletin is still the fastest way to learn what reasonable yarn evenness looks like for a given count and system, which is why it remains a recommended reference in textile-engineering programs at BUTEX and equivalent institutions.
Frequently Asked Questions
What does CVm stand for in Uster Statistics?
CVm is the coefficient of variation of yarn mass over a standard test length, calculated as 100 times the standard deviation of the mass signal divided by its mean. Lower CVm means a more even yarn. The Uster Statistics 2025 edition lists a median CVm of 12.5% for 30 Ne combed ring-spun cotton.
How often is Uster Statistics updated?
Uster Technologies has published a new edition roughly every five years since 1989. Major releases include 1997, 2007, 2013, 2018, and 2025. Each edition re-samples the world distribution from contributing mills and refreshes the percentile tables.
What is the difference between thin places, thick places, and neps?
Under ISO 16549, thin places are yarn segments with at least 50% lower mass than the running average, thick places are at least 50% higher, and neps are at least 200% higher, each counted per kilometer. Neps in cotton yarns typically come from immature or dead fibers that survive carding and drafting.
Which Uster parameter is most important for fabric quality?
There is no single answer: short-wavelength variation (CV1m and CV3m) drives visible barre and dye streaks in woven fabric, while long-wavelength variation (CV10m) drives weave-up defects and strength CV. Most mills monitor CVm and the three defect counts together and interpret each against its own control limit.
Are Uster Statistics still relevant with modern online sensors?
Yes. Online sensors on ring and rotor frames generate per-shift defect data, but Uster Statistics remains the global calibration reference for what average, good, and outlier mean for a given count and spinning system. The bulletin is the benchmark, while the dashboards are the daily control tool.
References
- ASTM International. ASTM D1425/D1425M-14 Standard Test Method for Evenness of Textile Strands Using Capacitance Testing. ASTM — defines the capacitance method used by Uster Tester instruments.
- International Organization for Standardization. ISO 16549:2004 Textiles: Yarn evenness. Determination of linear density. ISO — defines thin, thick, and nep thresholds for mass-variation testing.
- ASTM International. ASTM D2255 Standard Test Method for Grading Yarn by Appearance. ASTM — visual grading of yarn boards against standard photo plates.
- American Association of Textile Chemists and Colorists. AATCC Yarn Appearance Test Method. AATCC — appearance grading that complements capacitance-based Uster data.
- Choudhury, A. K. Modern Yarn Engineering: Advances in Spinning and Quality Testing. Woodhead Publishing — peer-reviewed monograph on spinning quality and evenness parameters.
- Veit, D., and colleagues. Comparative study of yarn evenness in ring, rotor, and air-jet spinning. Fibers (MDPI) — peer-reviewed analysis of spinning technology and CVm variation.
This article is the working reference for yarn evenness and Uster Statistics. Editorial by Iftay Khairul Alam, TextileTuts. Sources: ASTM D1425, ISO 16549, ASTM D2255, AATCC Yarn Appearance, Woodhead Publishing, Fibers (MDPI) as cited.


