
Yarn Evenness Testing: Uster Evenness Tester

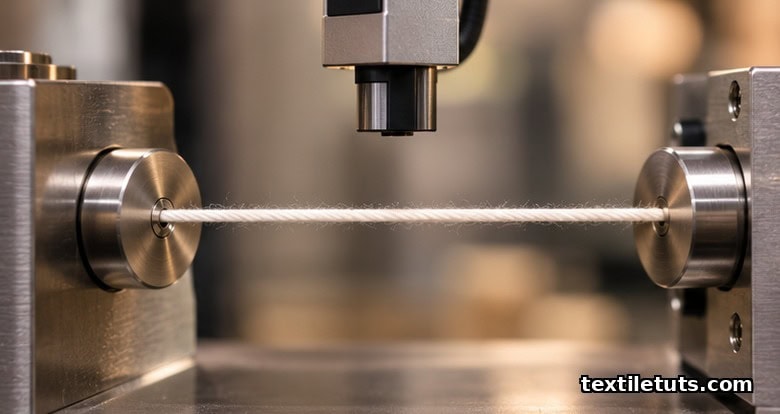
The Uster Evenness Tester measures yarn linear density variation along its length using capacitive and optical sensors at test speeds of 25 to 400 m/min, reporting Coefficient of Variation (CV%) and U% as the primary evenness indices under ISO 16549:2021 and ASTM D1425/D1425M-14(2021) test methods.
A standard test passes at least 100 m of yarn through the sensing zone, with 5 m discarded at each end, and records thin places (–50%, –40%, –30%), thick places (+50%, +100%, +200%), and neps (+280%, +400%) per 1,000 m of tested material, allowing mills to flag quality drift before fabric-level defects appear downstream. The article below explains what each reported parameter means, how the test is run under ISO 16549 and ASTM D1425, how results are interpreted against Uster Statistics 25% percentile benchmarks, and how to set up a reliable in-lab quality control routine for ring, rotor, compact-ring, and air-jet yarns.
What a Uster Evenness Tester Actually Measures
The instrument continuously samples yarn cross-section (linear density, in tex or denier equivalent) as the yarn runs through a capacitive or optical sensor. The sensor turns each millimetre of yarn into a voltage signal proportional to mass per unit length; that signal is logged, averaged over 1 m and 10 m segments (reported as CVm1m and CVm10m), and reduced to two headline numbers:
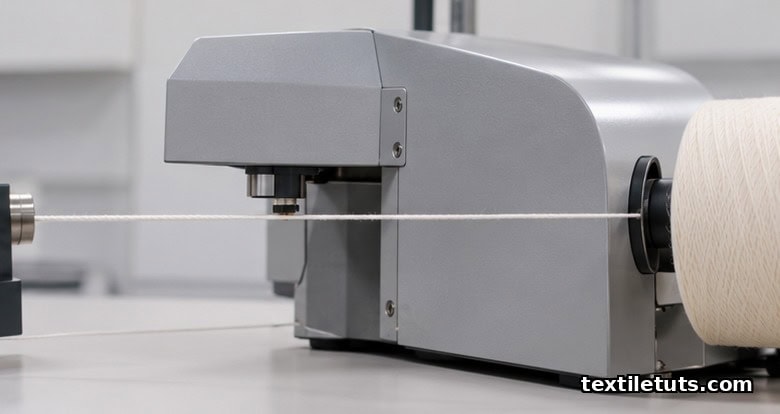
- CV% — Coefficient of Variation of mass per unit length over the entire tested length. Lower is better. For a 30 Tex ring-spun carded cotton yarn, a CV% near 16.5% corresponds to the Uster Statistics 25% benchmark.
- U% — Mean deviation unevenness (the average percentage difference from the mean), reported as a complementary index because it is more sensitive to long-wavelength drift than CV%.
A modern Uster Tester 5 or 6 reports additional parameters: hairiness (H, in mm of protruding fibre per metre of yarn), count variation, spectrogram (wavelength analysis of periodic mass variation plotted against wavelength in cm), and imperfection count (thin places, thick places, and neps per 1,000 m). Together these data tell a spinner whether variation is random, periodic (suggesting a faulty drafting roller, eccentric rotor, or wrongly set gear), or trend-driven (suggesting sliver quality issues upstream).
Standards Governing the Test
Two primary standards cover electronic yarn evenness testing, and most mills report results under both.
ISO 16549:2021, “Textiles: Yarn from packages: Determination of single-end yarn linear density and linear density variation using capacitive and optical methods,” defines the test method, sample length (at least 100 m per package), pretension (typically 0.5 ± 0.1 cN/tex), and ambient conditions (20 ± 2 °C, 65 ± 4% RH after ISO 139 conditioning). ASTM D1425/D1425M-14(2021) covers the equivalent procedure for U.S. laboratories and is widely cited in trade documentation. Both standards require the test to be performed at a defined cross-sectional speed of 25, 50, 100, 200, or 400 m/min depending on yarn count and instrument capability.
AATCC TM 169-2020, “Test Method for Evenness of Yarns Using Electronic Evenness Testers,” applies when the data feeds a fabric-quality investigation that also draws on AATCC fabric-appearance grading. For most mills, ISO 16549 is the controlling standard; ASTM D1425 is reported alongside it for U.S. customers, and AATCC TM 169 is added when the result supports a fabric-grade study.
Step-by-Step Test Procedure
The procedure is consistent across standards. A correct run takes 8 to 12 minutes per package and should follow these steps.
- Condition the yarn. Bring packages to standard atmosphere (20 ± 2 °C, 65 ± 4% RH) for at least 24 hours. ISO 139 and ASTM D1776 specify the conditioning protocol.
- Set the pretension. Apply 0.5 ± 0.1 cN/tex to remove slack without stretching. Pretension is critical: too low gives a noisy signal, too high elongates the yarn and biases the CV% low.
- Choose the test speed. Use 100 m/min for routine quality control of ring-spun yarns finer than 40 Tex; use 200 m/min for coarse rotor yarns or where high sample throughput is required. Higher speeds amplify drafting disturbances and can inflate CV% by 0.3 to 0.5 percentage points.
- Run the test length. Test at least 100 m per package. For acceptance sampling, ISO 16549 recommends testing 10 packages per lot.
- Discard the start-up and tail. Discard the first 5 m (acceleration artefact) and last 5 m (run-out artefact) from the reported data.
- Record the report. Log CV%, U%, CVm1m, CVm10m, imperfection count, spectrogram, and hairiness H for each package.
Each package test produces a single report. A lot-level QC decision averages the per-package CV% across the 10 packages and compares the lot mean against the Uster Statistics percentile benchmark for that yarn count and spinning system.
Interpreting CV% and Imperfection Counts
Raw CV% has no meaning without context. Two factors control the interpretation: yarn count (finer yarns inherently show higher CV%) and spinning system (compact ring, conventional ring, rotor, and air-jet each have different benchmark ranges). The table below summarises typical 25% percentile Uster Statistics values for selected cotton and blended yarns.
| Yarn type | Linear density | CV% (25% benchmark) | Thin places /1,000 m (–50%) | Thick places /1,000 m (+50%) | Neps /1,000 m (+280%) |
|---|---|---|---|---|---|
| Ring-spun combed cotton | 20 Tex | 13.5 | 5 | 35 | 50 |
| Ring-spun carded cotton | 30 Tex | 16.5 | 25 | 120 | 180 |
| Compact ring-spun cotton | 30 Tex | 15.5 | 15 | 80 | 100 |
| Rotor-spun cotton | 30 Tex | 15.0 | 10 | 80 | 30 |
| Air-jet polyester-cotton (65/35) | 30 Tex | 12.5 | 3 | 25 | 20 |
If a lot exceeds the 50% benchmark by more than 1.0 percentage point CV%, it signals an actionable process fault. The most common root causes, ranked by frequency observed in spinning-mill audits, are:
- Drafting-roller eccentricity or wear: shows as a periodic peak in the spectrogram at the draft-roller circumference (typically 4 to 8 cm wavelength). Replace or re-grind the roller.
- Rotor-groove wear (rotor yarns): raises neps and thick places with no periodic signal. Replace the rotor after 2,500 to 3,000 kg of throughput.
- Sliver-weight variability: produces long-wavelength CVm10m fluctuation. Correct by re-checking the draw-frame draft and sliver-coiler calibration.
- Traveller condition (ring yarns): a worn traveller raises thick places by 20 to 40% before it affects ends-down. Replace travellers every 2 to 4 days on a 30 Tex line.
Hairiness and Spectrogram: Two Often-Missed Diagnostics
CV% and imperfection count are the headline numbers, but two diagnostic outputs often catch process faults earlier than the headline values.
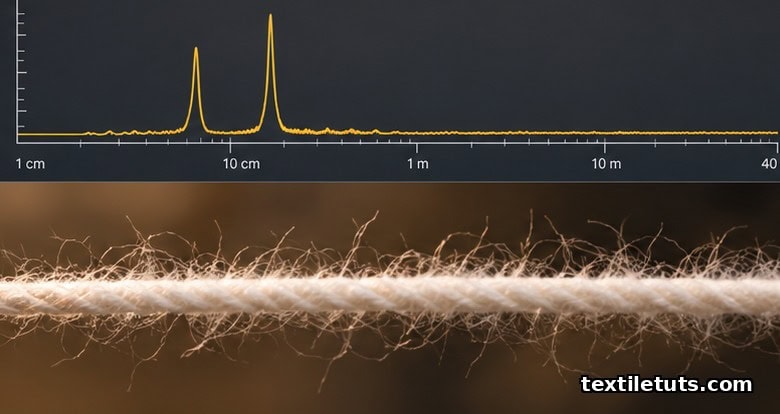
Hairiness H is reported in mm of protruding fibre per metre of yarn. A 30 Tex ring-spun cotton typically reads 4.0 to 5.5 mm; compact-ring and air-jet yarns read 2.5 to 3.5 mm. A sudden rise in H without a matching CV% increase points to a traveller, separator, or balloon-control problem rather than a drafting fault. H above 6.5 mm on a 30 Tex ring yarn is rarely customer-acceptable for woven shirting.
The spectrogram plots amplitude against wavelength from about 1 cm to 40 m, so periodic faults appear as sharp peaks at the wavelength of the offending mechanical part. A peak at 4.2 cm on a ring-spinning frame typically indicates the front drafting roller; a peak at 8.0 cm implicates the middle roller; broad peaks at 100 to 300 cm usually mean sliver variation, not a frame-level problem.
Setting Up a Mill QC Routine
A reliable QC routine uses both per-shift and per-lot testing. A pragmatic schedule for a 30,000-spindle mill testing 30 Tex ring-spun cotton:

- Per shift: 1 package per machine, on 5 randomly selected spindles per machine, totalling about 50 tests. Compare against the 25% benchmark; investigate any reading more than 1.5 percentage points above the lot mean.
- Per lot: 10 packages per lot, averaged. Reject the lot if the lot-mean CV% exceeds the 50% benchmark by more than 0.7 percentage points, or if any single package exceeds the 75% benchmark.
- Monthly: full spectrogram and hairiness review on at least 3 representative frames, looking for emerging periodic peaks before they fail the CV% limit.
Document each test with package ID, frame, spindle position, date, time, ambient RH, and operator. The trend over 30 days usually reveals whether CV% drift is process-driven (gradual) or event-driven (sudden step), and the corrective response differs in each case.
Frequently Asked Questions
What is the difference between CV% and U% on a Uster Evenness Tester?
CV% is the coefficient of variation of mass per unit length, expressed as a percentage of the mean. U% is the mean absolute deviation from the mean, also expressed as a percentage. CV% is the international reference figure and is what Uster Statistics benchmarks report. U% is more sensitive to long-term drift and is sometimes preferred in process control where slow changes matter most. For a typical 30 Tex ring-spun cotton yarn, U% runs roughly 30 to 35% higher than CV%.
How much yarn is needed for a single Uster test?
ISO 16549 specifies a minimum of 100 m per package, with 5 to 10 m discarded at each end. For lot-level decisions, ISO 16549 recommends testing 10 packages per lot, giving 1,000 m of tested yarn per lot plus conditioning time. Practical mill throughput allows 30 to 60 packages tested per shift on a single Uster Tester 5 instrument.
Can the Uster test be run on a textured filament yarn, or only on spun yarns?
The capacitive and optical methods defined in ISO 16549 work on any yarn where cross-sectional mass variation is the variable of interest, including textured polyester and nylon filament yarns. Filament yarns typically report CV% values 30 to 50% lower than spun yarns of the same linear density because filament yarn has no fibre-level drafting variation. Hairiness is not measured for filament yarns because the parameter is meaningless without free fibre ends.
Why are my CV% readings drifting even though no mechanical part has changed?
Slow CV% drift over days or weeks is almost always an upstream fibre or humidity issue. Cotton micronaire variability of 0.5 units changes CV% by about 0.3 to 0.5 percentage points on the same ring frame. Relative humidity outside the 60 to 70% range shifts CV% by 0.5 to 1.0 percentage points. Re-check fibre-lot consistency, opening-room condition, and draw-frame humidity controls before suspecting spinning-frame hardware.
Does a higher CV% always mean a worse yarn?
For most woven and knitted fabric applications, yes, but with two caveats. First, the relevant benchmark depends on the spinning system: a 30 Tex rotor yarn and a 30 Tex compact-ring yarn have different expected CV% ranges. Second, some specialised applications tolerate higher CV% if the imperfection count is also low; for example, denim weft yarns with deliberately uneven thickness can still produce acceptable fabric. Compare to the Uster Statistics 25% benchmark for the same yarn type, not to an absolute threshold.
References
- International Organization for Standardization. ISO 16549:2021: Textiles: Yarn from packages: Determination of single-end yarn linear density and linear density variation using capacitive and optical methods. https://www.iso.org/standard/76530.html — defines test speed, sample length, pretension, and reporting metrics.
- ASTM International. ASTM D1425/D1425M-14(2021): Standard Test Method for Evenness of Yarns Using Electronic Evenness Testers. https://www.astm.org/d1425_d1425m-14r21.html — equivalent U.S. standard for capacitive and optical evenness testing.
- American Association of Textile Chemists and Colorists. AATCC TM 169-2020: Test Method for Evenness of Yarns Using Electronic Evenness Testers. https://www.aatcc.org — U.S. test method referenced when evenness data feeds fabric-appearance grading.
- Uster Technologies AG. USTER STATISTICS 2018: The Global Benchmark for Yarn Quality. https://www.uster.com — industry reference percentile benchmarks for CV%, imperfections, and hairiness by yarn type and count.
- ResearchGate. Influence of yarn evenness on the physical properties of woven fabric (peer-reviewed). https://www.researchgate.net — empirical study correlating CV% with fabric strength and appearance grading.
- MDPI Textiles. Effect of spinning system on yarn hairiness and evenness (peer-reviewed). https://www.mdpi.com/journal/textiles — comparison of ring, compact, rotor, and air-jet hairiness and CV% values.
Editorial by Iftay Khairul Alam, TextileTuts. Sources: ISO 16549:2021, ASTM D1425/D1425M-14(2021), AATCC TM 169-2020, USTER STATISTICS 2018, and peer-reviewed work indexed on ResearchGate and MDPI Textiles as cited.


