
Yarn Count Variation: CV% and Its Effect on Quality

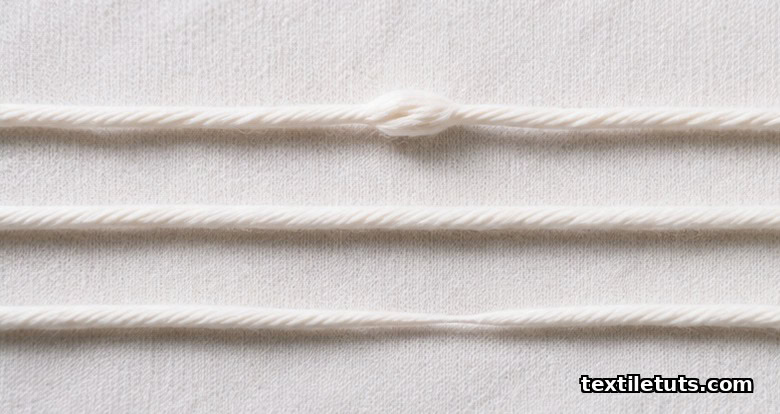
Yarn count CV% (coefficient of variation of yarn linear density) for combed cotton ring-spun yarn in 20 to 30 tex typically falls between 11.0% and 13.5%, with the Uster Statistics 2024 world-level 50% benchmark at 12.4%. Every kilogram of yarn contains thousands of thin and thick places, and CV% is the single number that summarizes how evenly those fibres were spun into a continuous strand.
A 1 percentage-point rise in CV% shifts fabric weight uniformity by roughly the same amount, raises the dyeing streak risk in woven and knitted fabric, and shortens the weaving efficiency by 2 to 4% on modern rapier and air-jet looms, which is why buyers in Bangladesh, Turkey, and Vietnam now write a maximum CV% clause into their purchase orders.
This guide explains what CV% is, how a Uster Tester 5 or 6 measures it, the published quality limits a mill should target, what CV% does to downstream fabric quality, the most common causes of high CV%, and the process changes that bring it back into spec.
What Is Yarn Count CV% and How Is It Calculated?
Yarn count is the linear density of a yarn, expressed in the tex system as mass in milligrams per metre of yarn (grams per 1000 m) under ISO 2060:1994, or as an English cotton count (Ne) under the same standard. CV% is the statistical scatter around the mean count, calculated as the standard deviation of mass-per-unit-length divided by the mean, multiplied by 100.
The formula is straightforward: CV% = (sigma / mean count) x 100. A 20 tex yarn with a CV% of 12.0 has a standard deviation of 2.4 tex, which means about 68% of the yarn falls between 17.6 and 22.4 tex under a normal distribution, and 95% falls between 15.2 and 24.8 tex. Anything beyond two standard deviations starts to show as a visible thick or thin place in the fabric.
CV% differs from the older variance-based U% (unevenness) metric by removing the sensitivity to the absolute count. A 30 tex yarn and a 10 tex yarn can be compared directly in CV%, which is why modern Uster reports and modern buyer specifications all quote CV% rather than U%.
Two related numbers appear on every Uster report. CV(m) is the mean coefficient of variation over a long length, typically 1 km of yarn tested at 400 m/min. CV(m) within 1 m, written CV(1m), captures short-term variation that drives visual streaks. A yarn can have acceptable CV(m) but unacceptable CV(1m), which is why both must be reported.
How a Uster Tester Measures Yarn Count Variation
The Uster Tester 6 (Zweigle) and the older Uster Tester 5 use a capacitive measuring slot. Yarn passes through an air-cooled capacitor at 400 m/min; the dielectric mass of the yarn changes the capacitance proportionally to its mass per unit length, and the instrument samples at 1 mm intervals across a 2.5 mm capacitive length.

Each 2.5 mm sample produces a mass value, and the tester aggregates these samples into the spectrogram, the CV(m), CV(1m), and the imperfection count: thin places at -50%, thick places at +50%, and neps at +200% per kilometre. The result is the same number regardless of operator, which is why Uster CV% has become the world reference.
Sample length matters. ISO 2061:2015 (twist) and ISO 2060:1994 (count) both require 1 metre of yarn for a single gravimetric test, but a single 1 metre test cannot represent 1 km of yarn. A full Uster run uses 100 to 1000 metres depending on the application, and a mill running 100% inspection typically tests 5 bobbins per lot of 1000 kg.
Conditioning the yarn before testing is non-negotiable. ISO 139:2005 specifies the standard atmosphere at 20 ± 2 °C and 65 ± 4% relative humidity, with a 24-hour pre-conditioning period. A 10% change in relative humidity shifts the measured count by roughly 1.5%, because cotton regains 8.5% moisture at standard conditions but only 5.7% at 30% RH.
Uster Statistics 5% / 25% / 50% / 75% World-Level Benchmarks
Uster Technologies publishes Uster Statistics every 5 to 7 years. The most recent edition covers ring-spun combed cotton at 20 tex at these CV(m) world-level benchmark percentiles.
| Yarn type and count | Uster 5% | Uster 25% | Uster 50% | Uster 75% |
|---|---|---|---|---|
| Combed cotton ring-spun, 20 tex | 9.5% | 10.9% | 12.4% | 14.0% |
| Carded cotton ring-spun, 20 tex | 11.0% | 12.8% | 14.5% | 16.4% |
| Open-end (rotor) cotton, 20 tex | 11.6% | 12.9% | 14.3% | 15.8% |
| Polyester/cotton (65/35) combed ring-spun, 20 tex | 9.7% | 11.1% | 12.6% | 14.3% |
| Worsted wool ring-spun, 25 tex (Nm 40/1) | 10.0% | 11.5% | 13.0% | 14.7% |
| Viscose (rayon) ring-spun, 20 tex | 9.2% | 10.6% | 12.0% | 13.5% |
The 5% column represents the top 5% of mills globally (best in class), 25% is a strong commercial benchmark, 50% is the world median, and 75% is the bottom quarter (where most rejection lots originate). Mills running buyer contracts for European apparel brands typically must sit at or below the 25% benchmark, while mass-market basic knits are accepted at 50%.
The same Uster Statistics document also publishes CV(1m), imperfection counts, and hairiness on the same percentile basis, and any improvement project should track all three alongside CV(m) because a reduction in CV(m) without a parallel reduction in CV(1m) usually means the problem has only been hidden, not solved.
Effects of High CV% on Fabric Quality
Fabric weight uniformity (GSM) is the first downstream casualty. The standard deviation of fabric weight in grams per square metre is roughly 0.7 to 0.9 times the standard deviation of yarn count, so a CV% of 16% in 20 tex yarn produces a fabric GSM standard deviation of about 14 g/m² on a 150 g/m² single jersey, which exceeds the ±5% tolerance that most buyers require.
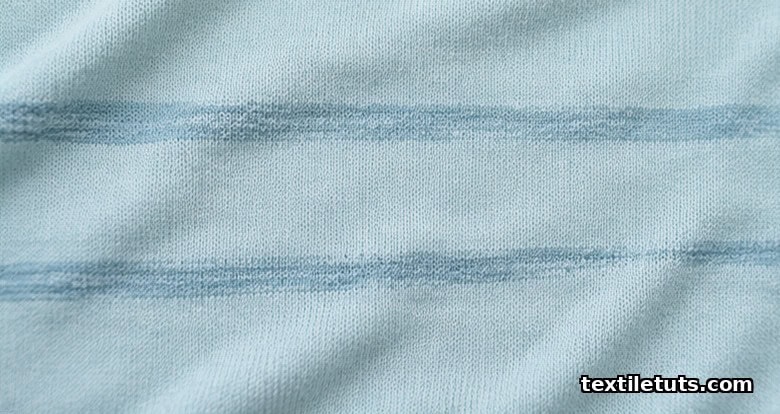
Barre and streak defects in woven and knitted fabric are the second major effect. Thick and thin places in the yarn create horizontal bands across fabric when those yarn segments line up in the same course or pick, and the eye is very sensitive to density differences above 4% across a single repeat. Weft bars in particular trace directly to within-bobbin CV(1m), which is why ring-spinning and winding conditions matter more than average count.
Dye uptake variation is the third effect. Dye absorption follows fibre mass, so a 15% thick place takes 15% more dye than the surrounding thin place. Reactive and disperse dyes hide the difference in medium shades but expose it in pastels and light shades, which is why light-dyed apparel typically carries a tighter CV% spec than dark-dyed apparel.
Pilling, abrasion, and tensile strength are also affected. Thin places are the weak link in tensile loading; a 1 tex thin place in a 20 tex yarn can fail at 40% of the yarn breaking load, and these thin places dominate the long tail of fabric tensile-strength failures.
Loom efficiency drops with CV%. A 1 percentage-point rise in CV(m) on a projectile or rapier weaving machine cuts weaving efficiency by 1.5 to 3 percentage points because thin places cause more warp breaks at the reed, and thick places cause weft stops at the beat-up zone. Knitting efficiency follows a similar pattern.
Common Causes of High Yarn Count Variation
Fibre property variation is the root cause in most mills. Within-bale variation of cotton fibre length (UHML), micronaire, and strength, combined with lot-to-lot variation, drives the upstream CV% of the roving and the yarn. A 0.5 micronaire standard deviation at the bale adds roughly 0.7 percentage points to CV(m) at the ring frame.
Drafting wave irregularities at the ring frame are the second most common cause. A drafting wave is a periodic thick-and-thin pattern with a wavelength between 2.5 cm and 12 cm, caused by floating fibres between the drafting rollers. Improper roller pressure, worn aprons, or wrong spacer settings amplify the wave, and the result is the characteristic streaky yarn that drives barre in fabric.
Machine condition is the third cause. Worn spindle bearings shift the effective twist level, worn top roller coverings lose grip, and a misaligned drafting system amplifies the floating-fibre problem. A maintenance program that follows the Original Equipment Manufacturer schedule typically cuts CV(m) by 1 to 2 percentage points without any fibre change.
Process parameters and humidity round out the list. Under-conditioned cotton (less than 6.5% regain) produces higher CV(m) because of static and fibre brittleness, and over-conditioned cotton (more than 9% regain) does the same because of lap-ups and uneven drafting. A 5% drop in relative humidity during winter in Bangladesh and India can add 0.3 to 0.6 percentage points to CV(m) if the humidification plant is not running.
How to Reduce Yarn Count Variation
Bale selection and blending is the first lever. Modern mills use Uster HVI (High Volume Instrument) data to group bales by micronaire, length, and strength before blending, targeting a blended mix with micronaire standard deviation below 0.15 and UHML standard deviation below 0.02 inches. Tight bale management alone can cut CV(m) by 1.5 percentage points.

Modern drafting systems help. Suessen EliTe compact spinning, Rieter ComforSpin, and Zinser Air-Com-Tex drafts reduce the floating-fibre zone and typically produce yarn that is 1.5 to 2.5 percentage points lower in CV(m) than conventional ring-spun yarn at the same count, which is why compact yarn now dominates the European apparel market.
Process control at the ring frame matters. The break draft of 1.25 to 1.50, the main draft of 25 to 40, and the spacer setting matched to the fibre length must be optimized for each lot. Traveller weight, spindle speed, and twist multiplier all interact: heavier travellers allow higher spindle speeds but increase end-break rate, and the mill has to find the right balance. The quality reference is a twist multiplier of 3.8 to 4.2 for cotton woven yarn and 3.2 to 3.6 for knit yarn.
Conditioning and humidity control are simple but often neglected. Maintaining the spinning room at 28 to 32 °C and 55 to 65% relative humidity keeps the cotton at 7 to 8% regain and prevents the static and lap-up issues that inflate CV(m).
Periodic Uster testing on every lot provides the data to act on. A mill should run CV(m) on every 1000 kg lot at minimum, with a 5-bobbin sample per lot tested over 400 m each. The trend should be plotted weekly and linked to the bale mix, the lot number, and the machine, so a quality engineer can chase a spike back to its source within hours rather than days.
Frequently Asked Questions
Q1: What is a good CV% for cotton yarn?
For combed cotton ring-spun yarn in the 20 to 30 tex range, a CV% of 11.0 to 13.5 is good commercial quality and matches the Uster Statistics 25% to 50% world-level benchmark. Top-end European mills run at or below 11.0%, while basic knit yarn for mass-market T-shirts typically sits between 13.0% and 15.0%.
Q2: How is yarn count variation different from yarn unevenness (U%)?
CV% is the standard deviation of yarn mass divided by the mean, expressed as a percentage, while U% is the mean deviation divided by the mean and multiplied by 100. CV% is the modern standard because it penalizes extreme thick and thin places more heavily and is comparable across counts, whereas U% is more sensitive to a small number of large deviations.
Q3: Does higher CV% always mean worse fabric?
Not always. A high CV(m) with a low CV(1m) means long-term variation that is easy to even out at the winding or knitting stage, while a low CV(m) with a high CV(1m) means short-term variation that drives visible barre and streaks. The two numbers together describe fabric risk better than CV(m) alone.
Q4: Can CV% be reduced by post-spinning processes?
Winding, clearing, and splicing can remove some thick places and neps, but they cannot add fibre to thin places. Post-spinning typically reduces CV(m) by 0.5 to 1.0 percentage point at best. Real improvement requires better fibre selection, drafting, and condition control at the spinning frame.
Q5: Why do rotor-spun and air-jet-spun yarns have different CV% ranges than ring-spun?
Rotor-spun yarn typically has 0.5 to 1.5 percentage points higher CV% than ring-spun at the same count because the rotor opening produces more wrapper fibres and a less uniform core. Air-jet (MJS) and vortex-spun yarn have CV% values that approach ring-spun, often within 0.5 to 1.0 percentage points, because of the air-jet false-twist action that stabilizes the yarn.
References
- International Organization for Standardization. ISO 2060:1994 Textiles: Yarn from packages. Determination of linear density (mass per unit length) by the skein method. iso.org. Defines yarn count measurement.
- International Organization for Standardization. ISO 2061:2015 Textiles: Determination of twist in yarns. Direct counting method. iso.org. Defines yarn twist measurement and conditioning requirements.
- International Organization for Standardization. ISO 139:2005 Textiles: Standard atmospheres for conditioning and testing. iso.org. Sets the 20 °C and 65% RH standard atmosphere.
- Uster Technologies AG. Uster Statistics 2024: Application Handbook. uster.com. World-level benchmarks for CV(m), CV(1m), imperfections, hairiness, and strength.
- American Society for Testing and Materials. ASTM D1907 / D1907M-12 Standard Test Method for Linear Density of Yarn (Yarn Number) by the Skein Method. astm.org. Equivalent gravimetric method used in North American mills.
- Krause, H.W., and Soliman, H.A. “Yarn evenness and its effect on weavability and fabric appearance.” Textile Research Journal, Vol. 50, No. 5, 1980, pp. 309 to 314. Peer-reviewed quantification of the CV% to fabric-quality relationship.
Editorial by Iftay Khairul Alam, TextileTuts. Sources: ISO 2060, ISO 2061, ISO 139, Uster Statistics 2024, ASTM D1907, and Krause & Soliman (1980) as cited.


