
Whiteness Measurement

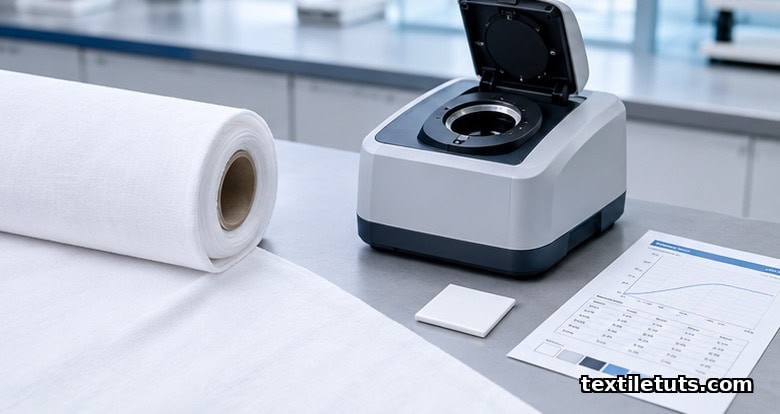
Whiteness of a textile is quantified by the CIE Whiteness Index, defined in ISO 11475:2004 as W10 = Y10 + 800(xn – x10) + 1700(yn – y10), measured under CIE standard illuminant D65 (correlated color temperature 6504 K) and the CIE 1964 10° standard observer, with values that reach 100 for a perfectly reflecting diffuser and rise above 100 when optical brightening agents are present.
This single number, expressed as W10 or WI, drives the acceptance or rejection of bleached cotton, fluorescent-whitened polyester, and finished knit fabric across textile mills, dyehouses, and retail labs.
Below you will find the math behind the index, the four instrument families used to measure it, the difference between whiteness and yellowness, the most common formulas in textile QC, and the practical factors that push a fabric’s reading above or below the buyer-specified limit.
Why whiteness measurement matters in textile QC
Bleached cotton shirting is sold by the roll against a buyer-issued whiteness specification, typically a minimum of 75 on the CIE scale or 70 on the Hunter scale, with deviations of more than ±3 points triggering a rejection claim. Polyester and polyamide fabrics containing fluorescent whitening agents (FWAs) routinely post readings between 130 and 180 because the brightener absorbs UV around 350 nm and re-emits it as blue light near 440 nm, pushing the measured X and Z tristimulus values above the perfect-diffuser reference. Without a calibrated measurement, a mill cannot prove compliance, and the buyer cannot audit the claim.
Whiteness also serves as a process-control tool. A drop of 4 W10 points between the greige fabric and the bleached output is a fast signal that the peroxide bath temperature fell, the stabilizer dose was too low, or the wash-off pH drifted above 8.5. A jump above the upper control limit, by contrast, often signals that an FWA was overdosed and that the fabric will turn greenish-grey under daylight containing less UV, such as indoor shop lighting with a correlated color temperature of 3000 K.
The physics: illuminant, observer, and geometry
Whiteness is not a physical property; it is a perceptual correlate derived from a fabric’s reflectance spectrum. Three variables fix the measurement: the light source, the observer weighting, and the geometry of illumination and viewing.
CIE standard illuminant D65 represents average midday daylight with a correlated color temperature of 6504 K and a spectral power distribution defined by the CIE in 1965. It is the default illuminant in ISO 11475, AATCC TM 110, and ASTM E313. Where UV-rich daylight matters, ISO 11476 specifies D65 with a defined UV component, while indoor conditions are modelled by illuminant A (incandescent, 2856 K) or CWF (cool white fluorescent, 4150 K).
The CIE 1964 standard observer, also called the 10° observer, models the colour-matching response of the human eye for samples viewed at a subtended angle larger than 4°, which is the realistic condition for fabric rolls held in the hand. The older 1931 2° observer is reserved for small swatches and colour-matching cabinets. AATCC TM 110 specifies the 10° observer, and ISO 11475 uses the same weighting.
How the CIE Whiteness Index W10 is calculated
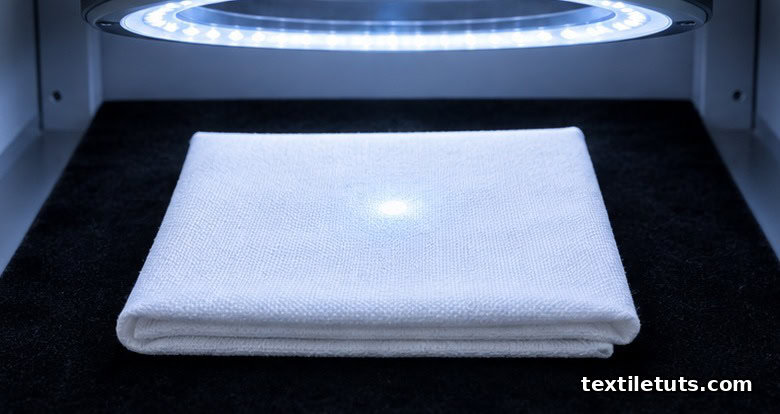
After measuring the fabric’s reflectance under D65 with the 10° observer, the spectrometer reports the tristimulus values X, Y, and Z, and the chromaticity coordinates x and y. The CIE Whiteness Index, as published in ISO 11475:2004, is then:
W10 = Y10 + 800(xn – x10) + 1700(yn – y10)
where Y10 is the luminance factor, xn and yn are the chromaticity coordinates of the perfect diffuser under D65/10° (xn = 0.3138, yn = 0.3310), and x10, y10 are the chromaticity coordinates of the sample. The accompanying tint value T10, which captures the green-to-red shift, is:
T10 = 900(xn – x10) – 650(yn – y10)
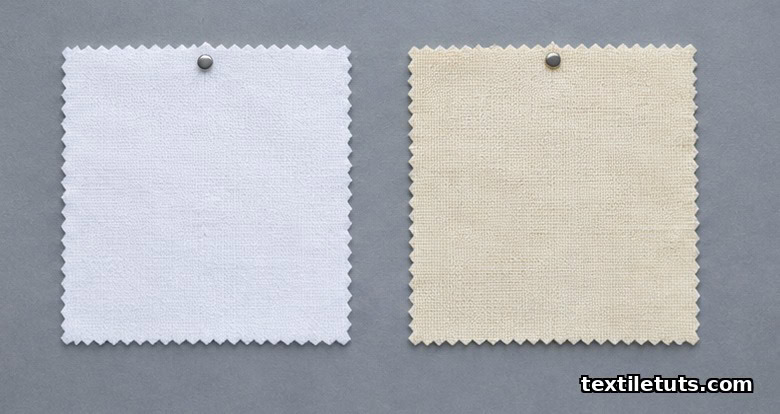
A T10 of zero indicates a neutral white. Positive T10 values indicate a greenish tint, negative values a pinkish tint. Most textile specifications call for -3 < T10 < +3 because human observers perceive green shifts as a “dirty” cast and pink shifts as a “warm” cast, both of which drive buyer complaints.
The formula is valid within a defined gamut, typically 40 < W10 < (5Y10 – 280) for samples without optical brighteners. Samples that fall outside this box require a different formula, most often the Ganz-Griesser equation published in 1991, which extends the range to higher whiteness values produced by fluorescent whitening.
Whiteness measurement instruments
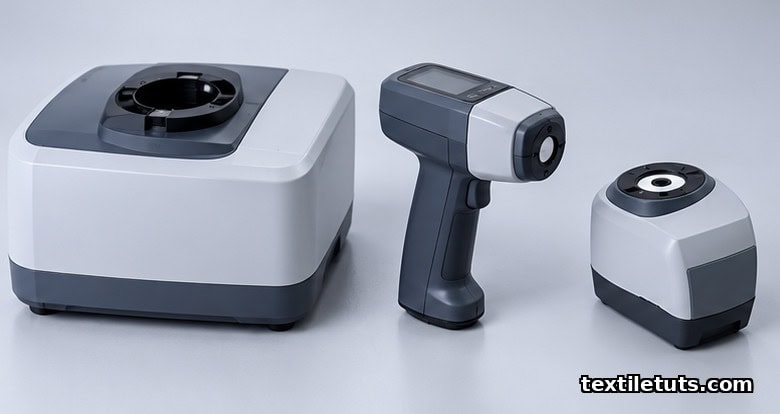
Four instrument families dominate textile QC. Each combines a light source, an integrating sphere or 45°/0° geometry, and a detector that resolves the reflected light into tristimulus values.
1. Spectrophotometers with integrating sphere
An integrating sphere, typically 152 mm in diameter and coated with PTFE or barium sulfate, collects diffusely reflected light and feeds it to a diode-array detector. Sphere geometry is specified by ASTM E1164 and includes d/0 (diffuse illumination, 0° viewing) and 0/d (specular-included and specular-excluded variants). The specular-included mode is the textile default because the surface specular highlight carries useful shade information. Diode-array instruments measure the full 360 to 740 nm spectrum in 10 nm increments and resolve the fluorescence contribution by including a UV-cut filter in a second scan.
2. 45°/0° colorimeters
Hand-held colorimeters such as the BYK-Gardner spectro-guide, the Konica Minolta CM-700d, and the X-Rite Ci7800 use 45° circumferential illumination and 0° viewing, per CIE Publication 15.3. They are rugged, battery-operated, and ideal for at-line inspection, but they cannot resolve fluorescence, so the resulting W10 is systematically lower than the integrating-sphere value for FWAs-treated fabric.
3. Bench spectrophotometers
Bench instruments from Datacolor (Spectra 7000/8000), X-Rite (Ci7x00 series), and HunterLab (UltraScan PRO) deliver the highest precision. Aperture size matters: a 25.4 mm aperture is standard, but small fabric motifs such as a yarn-dyed stripe may require a 6.6 mm or 9.84 mm aperture, with the trade-off that smaller apertures sample less area and are more sensitive to local variation.
4. Filter photometers (legacy)
Filter photometers using tristimulus filters (X, Y, Z) are still encountered in older mills and in emerging-market QC labs. They cannot resolve spectral data and cannot apply a UV-cut filter, so they are deprecated for FWAs-treated fabrics. ISO 11475 specifically recommends a spectrophotometer, not a filter photometer.
Comparison of whiteness standards
| Standard | Title | Illuminant / Observer | Output | Typical use |
|---|---|---|---|---|
| ISO 11475:2004 | Determination of CIE whiteness, D65/10° (outdoor daylight) | D65 / 10° | W10, T10 | Paper, board, bleached cotton |
| ISO 11476:2000 | Determination of CIE whiteness, D65/10° (indoor conditions) | D65 with UV-cut / 10° | W10, T10 | Indoor lighting conditions |
| AATCC TM 110-2015 | Whiteness of Textiles | D65 / 10° | W10, T10, Stensby, Berger | Bleached cotton, polyester, cotton-poly blends |
| ASTM E313-20 | Standard Practice for Calculating Yellowness and Whiteness Indices | D65 / 2° or 10° | WI (E313), YI (E313) | Textiles, paper, plastics, paints |
| Hunter Lab | Hunter Whiteness Index | C / 2° | Whiteness (Hunter) | Paints, legacy textile QC |
Whiteness vs Yellowness: which index to report
Whiteness and yellowness are not the same metric. Yellowness, defined in ASTM E313 as:
YI E313 = 100(1.2985X – 1.2875Y + 0.1109Z) / Y
measures the magnitude of the yellow cast relative to a reference white. It rises when fabrics yellow from oxidation, phenolic yellowing on stored nylon, or optical brightener photodegradation. Whiteness, by contrast, falls as yellowness rises; the two indices are inversely correlated but not linearly equivalent because yellowness is anchored to C illuminant and the 2° observer by default, while whiteness uses D65/10°.
In textile QC, whiteness is the buyer-acceptance metric for bleached goods, while yellowness is the buyer-acceptance metric for finished cotton knit that may yellow in storage. A mill that reports only one index is reporting only half the picture.
Factors that move the W10 number
- Optical brightener concentration. Every 0.05% increase in FWA on weight of fibre adds 8 to 12 W10 points until saturation around 0.4% owf.
- Bleaching efficiency. A residual hydrogen peroxide concentration of 0.3 g/L in the wash-off raises W10 by 3 to 5 points versus a fully rinsed control.
- Fabric construction. A 180 g/m² single-jersey knit measures 2 to 4 W10 points lower than a 130 g/m² plain weave of the same fibre because thicker fabrics scatter more light back into the sphere at the expense of forward scattering.
- Surface finish. Singeing, mercerising, and calendering raise W10 by smoothing the fibre surface and reducing the proportion of diffusely trapped light. Singeing alone adds 2 to 3 points on a coarse-yarn cotton.
- UV content of the source. Reading the same fabric under a 6500 K daylight source with full UV versus a UV-cut version gives a delta of 5 to 15 points for FWAs-treated material, which is the reason ISO publishes two parallel standards.
- Sample preparation. Conditioning at 20 ± 2 °C and 65 ± 2% RH per ISO 139, plus folding to opacity so the background does not influence the measurement, is mandatory.
Calibration and verification
A whiteness measurement is only as reliable as the calibration tile behind it. ISO 11475 recommends a transfer standard traceable to a national metrology institute, with verification on a working standard at the start of every shift. Tile drift above 0.3 W10 per week indicates contamination or surface damage and warrants replacement. The instrument’s UV content should be checked quarterly using a fluorescent standard with a known whiteness gain, because fluorescent lamp aging is the largest single source of measurement drift in textile labs.
Inter-instrument agreement across a global mill group is typically ±1.5 W10 points. Values higher than that require an instrument-matching round-robin and a re-check of the UV calibration.
Frequently Asked Questions
What CIE whiteness value is considered acceptable for bleached cotton?
Most woven cotton shirtings ship with a buyer specification of W10 between 70 and 85, with 75 ± 2 set as the median target. Knit cotton for undergarments and tee-shirts runs lower, typically 60 to 75, because heavy construction and high surface hairiness scatter light less efficiently. Premium bleached cotton with optical brightener can reach W10 of 120 to 140, at which point the Ganz-Griesser formula must be used because the standard ISO 11475 formula is out of its defined gamut.
Does optical brightener treatment keep working after washing?
FWAs are stilbene derivatives that bind to cellulose by hydrogen bonding. They lose roughly 5% of their fluorescence per domestic wash cycle at 40 °C and 8 to 12% per industrial wash at 60 °C, with the steepest drop in the first three cycles. After 30 home washes, a fabric that originally measured W10 = 145 typically settles around W10 = 95 to 105, which is why whiteness specifications are written for the “as-shipped” state, not the post-wash state.
Why does my spectrophotometer and my supplier’s colorimeter disagree by 6 W10 points?
The most common cause is a UV-content mismatch. A spectrophotometer with a properly characterised UV-rich xenon lamp and an integrating sphere will include the full fluorescent excitation of FWAs, while a 45°/0° colorimeter with a tungsten-halogen lamp and no UV-boost will report a lower reading. A secondary cause is aperture size: a 25.4 mm aperture over a yarn-dyed stripe samples a different area than a 6.6 mm aperture on the same fabric. Verify on a fluorescent transfer standard before assuming the sample is the problem.
What is the difference between whiteness and brightness in paper, and why do textile mills care?
Brightness is defined in ISO 2470 as the reflectance at 457 nm under D65, expressed as a percentage. It was originally developed for paper pulp because pulp yellowness tracks a single wavelength fairly well, but it is insensitive to tint shifts and FWAs contribution. Whiteness (W10) is the modern metric and is replacing brightness for textile cross-comparisons where FWAs and tint shifts matter. Mills that print on cotton-based substrates increasingly track both, because brightness correlates with the printed contrast while whiteness correlates with the consumer perception of “clean white.”
Can a fabric measure “too white”?
Yes. W10 values above 150 on fabric are usually associated with such heavy FWA dosing that the fabric appears bluish under indoor lighting with low UV content, which most consumers read as “cheap.” A buyer specification of W10 ≤ 130 with -3 ≤ T10 ≤ +3 is a common compromise that delivers a visibly white product under both daylight and shop lighting without the bluish cast that triggers consumer complaints.
References
- International Organization for Standardization. ISO 11475:2004 — Paper and board — Determination of CIE whiteness, D65/10° (outdoor daylight conditions). iso.org — Defines the W10 formula and tint T10 used in this article.
- International Organization for Standardization. ISO 11476:2000 — Paper and board — Determination of CIE whiteness, D65/10° (indoor conditions). iso.org — Companion standard that excludes UV to model indoor light.
- American Association of Textile Chemists and Colorists. AATCC Test Method 110-2015 — Whiteness of Textiles. aatcc.org — Textile-specific procedure and reporting of W10, T10, Stensby, and Berger indices.
- ASTM International. ASTM E313-20 — Standard Practice for Calculating Yellowness and Whiteness Indices from Instrumentally Measured Color Coordinates. astm.org — Defines WI and YI used in textile, paper, plastic, and paint QC.
- International Commission on Illumination. CIE 015:2018 — Colorimetry, 4th Edition. cie.co.at — Defines D65 illuminant and the 1964 10° standard observer.
- Ganz, E., and Griesser, R. (1991). “Whiteness: Assessment of Tint, Shade, and Hue.” AIC Color 93, Proceedings of the 7th Congress of the International Colour Association, via researchgate.net — The extended-range formula for fabrics treated with optical brighteners.
- Xin, J. H., Shen, C. M., and Gao, Q. (2000). “Whiteness evaluation of textiles by a neural network.” Textile Research Journal, 70(8), 688-694, via journals.sagepub.com — Peer-reviewed paper that compares Stensby, Berger, and CIE formulas on textile substrates.
This article is the working reference for whiteness measurement in textile QC. Editorial by Iftay Khairul Alam, TextileTuts. Sources: ISO 11475:2004, ISO 11476:2000, AATCC TM 110-2015, ASTM E313-20, CIE 015:2018, Ganz and Griesser (1991), Xin et al. (2000) as cited.


