
Vietnam and India Textile Manufacturing

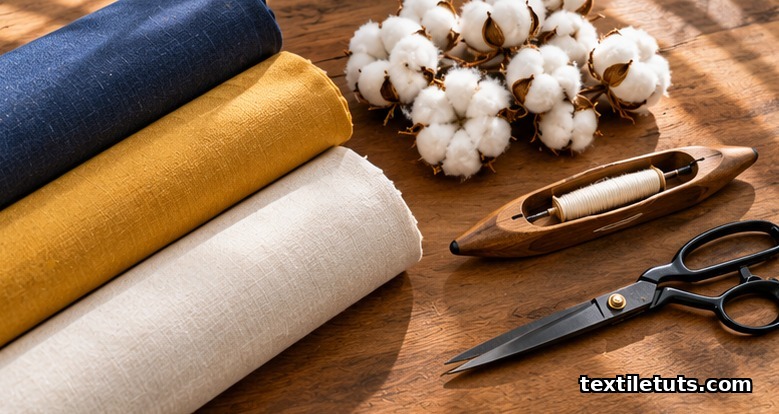
Vietnam and India together produced approximately $77 billion in textile and apparel exports in 2023, accounting for 14.8% of global textile trade, with Vietnam’s $44 billion export volume positioning it just behind China, and India’s $36 billion securing third place in the world.
Both countries have built manufacturing ecosystems that combine relatively low labor costs with rising technical capability, but they arrived at scale through different routes and they continue to compete in distinct product segments.
This article covers fiber sourcing, manufacturing capacity, labor economics, trade agreements, sustainability compliance, and how a sourcing buyer or textile student should compare the two industries.
Where Vietnam and India rank in global textile trade
According to the World Trade Organization’s 2024 trade statistics, the top five textile and apparel exporters in 2023 were China ($178 billion), Vietnam ($44 billion), Bangladesh ($38 billion), India ($36 billion), and Turkey ($30 billion). Vietnam and India together accounted for roughly $80 billion of the $651 billion in global textile and apparel exports that year.
India had been the second-largest textile exporter by value for most of the 2010s, but Vietnam overtook India in 2020 and has held that position since. Vietnam’s apparel exports grew at a compound annual growth rate of 8.4% between 2018 and 2023, while India’s apparel exports grew at 3.1% over the same period, according to data published by the Vietnam Textile and Apparel Association (VITAS) and India’s Ministry of Textiles.
Vietnam’s advantage in apparel comes from deep integration into global supply chains, particularly with brands headquartered in the United States, the European Union, Japan, and South Korea. India’s textile industry is larger in absolute fiber and yarn production, but a smaller share of that production crosses international borders because the domestic market absorbs so much of it.
Fiber production: cotton, synthetics, and man-made cellulosics
India is the world’s second-largest cotton producer after China, producing approximately 5.7 million metric tonnes of cotton in 2023-24 on 12.9 million hectares, according to the United States Department of Agriculture Foreign Agricultural Service. India also grows 60% of the world’s jute, harvests around 38,000 tonnes of silk each year, and produces approximately 7.6 million tonnes of man-made fibre annually, ranking it among the top four man-made fibre producers globally.
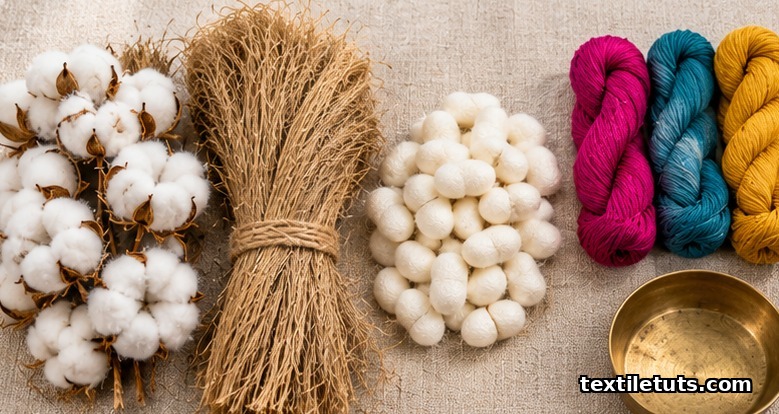
Vietnam, by contrast, has limited domestic fiber production. The country imports more than 90% of its cotton and virtually all of its synthetic fibers. According to the Vietnam Cotton and Spinning Association, Vietnam imported approximately 1.65 million tonnes of cotton and 1.2 million tonnes of synthetic fiber in 2023. The dependency on imported feedstock means Vietnamese spinners are sensitive to international cotton and polyester staple fiber prices, while Indian spinners benefit from a domestic cotton surplus.
India’s fiber diversity gives it a structural advantage in product mix. Indian suppliers can source coarse jute yarn, fine-count combed cotton, filament polyester, viscose staple, and silk from within the country. Vietnam specializes in cotton-rich blends and polyester-rich knit fabrics used in fast-fashion and sportswear, and cannot easily substitute cotton or polyester with domestic alternatives when global prices spike.
Manufacturing capacity: spinning, weaving, knitting, and dyeing
India had an installed spinning capacity of approximately 58 million ring spindles and 0.95 million rotors in 2023, according to the Office of the Textile Commissioner of India. India has 4,200 registered textile mills and roughly 50 million workers across the textile and apparel value chain.
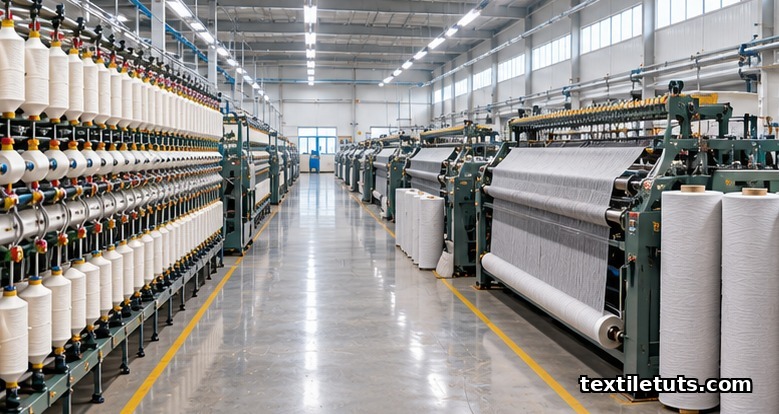
Vietnam had approximately 7.8 million ring spindles and 320,000 rotors in 2023, with around 6,500 textile and garment enterprises operating in the country, according to VITAS. The Vietnamese industry is more concentrated in fabric preparation and garment assembly than in upstream yarn spinning. Most Vietnamese knitting and weaving mills operate at a 70-75% capacity utilization rate, with the remaining slack held in reserve for short lead-time orders.
In dyeing and finishing, India operates more than 3,800 wet processing units but many are small batch facilities, while Vietnam has approximately 1,200 dyeing and finishing plants with larger average plant sizes due to the influence of foreign direct investment from Taiwan, South Korea, and Japan. Average lot size in Vietnamese dyehouses ranges from 5 to 50 tonnes, compared to 1 to 5 tonnes in the average Indian dyehouse.
| Indicator | India | Vietnam |
|---|---|---|
| Textile and apparel exports, 2023 (USD billion) | 36 | 44 |
| Cotton production, 2023-24 (million tonnes) | 5.7 | 0.002 (negligible) |
| Installed ring spindles (millions) | 58 | 7.8 |
| Number of textile enterprises | 4,200 registered mills | 6,500 enterprises |
| Textile workforce (millions) | 50 | 3.2 |
| Capacity utilization, weaving/knitting (%) | 65-70 | 70-75 |
| Average monthly minimum wage, 2024 (USD) | 70-110 | 130-190 |
| Free trade agreements with major markets | SAFTA, EU GSP+, ASEAN-India FTA | EVFTA, CPTPP, VKFTA, UKVFTA, ASEAN |
Labor economics and workforce skills
Vietnamese garment workers earn on average $240 to $360 per month including overtime, while Indian garment workers earn $130 to $210 per month in comparable factories. According to the International Labour Organization’s 2023 wage report for the Asia-Pacific region, Vietnam’s minimum wage rose 6.0% in 2023 to VND 4.68 million per month (approximately $190) for the highest region (Region 1), while India’s minimum wage varies by state with major textile states averaging INR 8,000 to 14,000 per month ($95 to $170).
Vietnamese factories typically employ 350 to 1,500 workers per facility, while Indian factories range from 200 to 5,000 workers. Workforce turnover in the Vietnamese garment sector averages 4-6% per month during peak season and 1-3% in the off-season, while Indian factories report 2-4% monthly turnover. Skill levels in sewing machine operation, fabric inspection, and pattern-making are broadly comparable in the two countries when measured against industry benchmarks, though Vietnam has a higher proportion of workers trained on automated cutting and fusing equipment.
India’s labor cost advantage is partially offset by lower productivity in some segments, while Vietnam’s higher wages are partially offset by lower defect rates. Average first-quality yield in Vietnamese woven shirt factories is 96.8%, compared to 94.5% in Indian woven shirt factories, according to buyer-side audits published by international compliance firms.
Trade agreements and market access
Vietnam has signed more bilateral and multilateral free trade agreements relevant to textiles than any other major Asian producer. The EU-Vietnam Free Trade Agreement (EVFTA), in force since August 2020, eliminated duties on 42% of Vietnamese textile tariff lines at entry into force and will eliminate duties on a further 48% over seven years. The Comprehensive and Progressive Agreement for Trans-Pacific Partnership (CPTPP) gives Vietnamese textiles duty-free access to Canada, Mexico, Japan, Australia, and seven other markets. Vietnam also has the UK-Vietnam FTA (UKVFTA) and the Korea-Vietnam FTA (VKFTA).
India’s textile exports benefit from the EU’s Generalised Scheme of Preferences Plus (GSP+), which grants reduced or zero duties on many textile categories. India also benefits from the South Asian Free Trade Area (SAFTA), the ASEAN-India FTA, and several bilateral FTAs including the India-UAE Comprehensive Economic Partnership Agreement. India does not have a free trade agreement with the United States, so Indian apparel exports to the US face standard MFN duty rates of 16-32% depending on fiber content.
The asymmetry of trade access is the single largest determinant of relative export competitiveness. For buyers sourcing for the US market, Vietnam typically wins on duty cost. For buyers sourcing for the EU, both countries enjoy similar duty outcomes. For buyers sourcing for India or the Middle East, India’s domestic market access gives it a structural advantage.
Sustainability, compliance, and environmental standards
Vietnam and India both export primarily into markets that require compliance with international social and environmental standards. The most commonly required certifications across both countries are OEKO-TEX Standard 100 for restricted substances, the Better Work Programme for labor conditions, ISO 14001 for environmental management, and buyer-specific standards such as the Higg Index and ZDHC for chemical management.
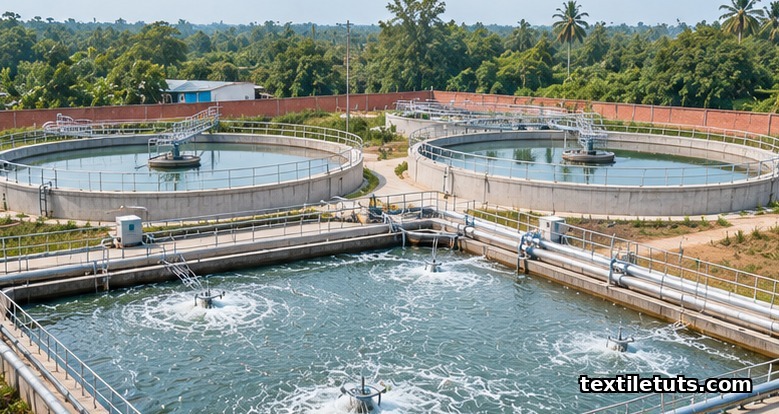
Both countries operate water-intensive textile processing. Average water consumption in Vietnamese dyehouses is 80 to 120 litres per kg of fabric, compared to 100 to 180 litres per kg in Indian dyehouses. Discharge of effluent into rivers is regulated by the Vietnam Ministry of Natural Resources and Environment under QCVN 40:2011/BTNMT, and by India’s Central Pollution Control Board under the Environmental (Protection) Act, 1986.
Color fastness to washing is tested under ISO 105-C06, color fastness to light under ISO 105-B02, and color fastness to rubbing under ISO 105-X12. Tensile strength of woven fabrics is tested under ISO 13934-1, and bursting strength of knitted fabrics under ISO 13938-1. Buyers typically require test reports from accredited laboratories such as SGS, Bureau Veritas, Intertek, or TUV.
Both countries have invested in Zero Discharge of Hazardous Chemicals compliant effluent treatment plants since 2018, with the largest concentration of ZDHC-aligned facilities located in Vietnam’s Ho Chi Minh City and Dong Nai provinces, and in India’s Tirupur and Surat clusters.
Frequently Asked Questions
Which country produces more textiles, Vietnam or India?
India produces more textiles in absolute volume because of its 5.7 million tonne cotton harvest, 58 million ring spindles, and 50 million-strong textile workforce, but Vietnam exports more textiles by value, recording $44 billion in textile and apparel exports in 2023 against India’s $36 billion. Vietnam specializes in cut-make-trim garment assembly for global brands, while India produces more upstream raw materials and finished fabrics for both domestic and export markets.
What is the main difference between Vietnam and India textile industries?
The main difference is the position in the value chain. Vietnam is concentrated in apparel assembly, with roughly 70% of textile exports in garments, and depends on imported fibers. India is integrated across the entire value chain from cotton farming to finished apparel, with the largest spinning base outside China. India’s domestic market of 1.4 billion consumers also absorbs a larger share of its output than Vietnam’s 100 million-person domestic market.
How do wages compare between Vietnamese and Indian textile workers?
Vietnamese garment workers earn $240 to $360 per month including overtime, while Indian garment workers earn $130 to $210 per month in comparable factories. Vietnam’s monthly minimum wage in Region 1 was VND 4.68 million (approximately $190) in 2023, while India’s state-level minimum wages in major textile states averaged INR 8,000 to 14,000 per month ($95 to $170). The 30-40% wage premium in Vietnam is partly offset by 2-3 percentage points higher first-quality yield.
Which certifications do factories in Vietnam and India typically hold?
Factories exporting to major Western brands in both countries typically hold OEKO-TEX Standard 100, ISO 9001 for quality management, ISO 14001 for environmental management, BSCI or Sedex for social compliance, and buyer-specific standards such as the Higg Index, ZDHC, and the Better Work Programme. Large Vietnamese and Indian manufacturers also hold SA8000 social accountability certification and WRAP certification.
Is Vietnam or India better for sourcing woven shirts?
For woven shirts sold into the US market, Vietnam typically wins on duty cost because of the CPTPP and bilateral US trade preferences. For woven shirts sold into the EU, both countries offer similar duty outcomes under EVFTA and EU GSP+ respectively. For woven shirts using Indian-grown extra-long staple cotton such as Suvin or DCH-32 varieties, India has a fiber-quality advantage that is difficult to replicate elsewhere.
References
- World Trade Organization. World Trade Statistical Review 2024. https://www.wto.org/english/res_e/statis_e/wts_e.htm — Reports global textile and apparel trade flows by country.
- United States Department of Agriculture Foreign Agricultural Service. Cotton: World Markets and Trade, August 2024. https://www.fas.usda.gov/data/cotton-world-markets-and-trade — Country-level cotton production, consumption, and stock data.
- International Organization for Standardization. ISO 105-C06:2010, Textiles, Tests for Colour Fastness, Part C06: Colour Fastness to Domestic and Commercial Laundering. https://www.iso.org/standard/32576.html — Standard test method for color fastness to washing.
- International Organization for Standardization. ISO 13934-1:2013, Textiles, Tensile Properties of Fabrics, Part 1: Determination of Maximum Force Using the Strip Method. https://www.iso.org/standard/60676.html — Standard test method for tensile strength of woven fabrics.
- International Labour Organization. Asia-Pacific Wage Report 2023. https://www.ilo.org/asia/publications/wage-reports — Minimum wage and living wage data across Asia-Pacific economies.
- Vietnam Textile and Apparel Association. Annual Report on the Vietnamese Textile and Garment Industry 2023. https://vitas.com.vn — Production capacity, exports, and workforce statistics for Vietnam.
- Office of the Textile Commissioner, Ministry of Textiles, Government of India. Annual Report 2023-24. https://texmin.nic.in — Spindle count, factory count, and workforce data for India.
- European Commission. EU-Vietnam Free Trade Agreement: Textiles and Apparel. https://policy.trade.ec.europa.eu/eu-trade-relationships-country-and-region/countries-and-regions/vietnam/eu-vietnam-agreement — Tariff schedule and rules of origin for textile products under EVFTA.
This article is the working reference for Vietnam and India textile manufacturing. Editorial by Mohammad Yousuf (Anik), TextileTuts. Sources: WTO World Trade Statistical Review 2024, USDA Foreign Agricultural Service Cotton report, ISO 105 and ISO 13934 series, ILO Asia-Pacific Wage Report 2023, VITAS Annual Report 2023, India Office of the Textile Commissioner Annual Report 2023-24, and European Commission EVFTA documentation as cited.


