
Spinning Mill Energy Consumption

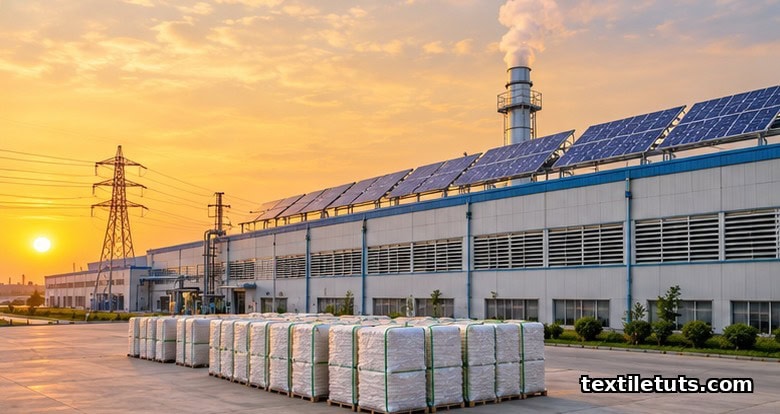
Spinning a kilogram of cotton yarn on a ring frame consumes 2.5 to 3.5 kWh of electricity, while rotor spinning uses 1.5 to 2.0 kWh per kg and air-jet spinning drops to 1.0 to 1.5 kWh per kg, with the spinning department typically absorbing 55 to 65 percent of a textile mill’s total electrical load.
The specific energy consumption (SEC) figure is the operational yardstick mills use to benchmark process efficiency, audit energy-saving projects, and qualify for ISO 50001 energy management certification.
This article breaks down the kWh-per-kg profile of every spinning process, compares ring, rotor, and air-jet systems side by side, and lists the recovery and renewable options that cut spinning-mill energy use by 15 to 30 percent.
Where the kWh Goes: Energy Share by Spinning Process
Spinning is the most electricity-intensive department in a conventional yarn mill. A 2014 survey of Indian composite mills by the Bureau of Energy Efficiency placed spinning’s share of total mill electricity at 58 percent on average, with the remaining load split between weaving (around 18 percent), wet processing (around 15 percent), and utilities such as humidification plant, lighting, and compressed air (around 9 percent).
The internal distribution inside the spinning department is uneven. On a 100 percent basis, ring frames dominate the load. A typical 30s Ne cotton yarn mill will see roughly 65 to 70 percent of spinning electricity go to ring frames, 12 to 15 percent to blowroom and carding, 8 to 10 percent to drawing and roving, 5 to 7 percent to winding, and the balance to auxiliary systems such as humidity plant, suction, and lighting.
The numbers shift when the machine mix changes. A mill running only rotor machines will see spinning SEC drop by 30 to 40 percent against a ring-only baseline, because rotor units run at higher delivery speeds and eliminate the roving stage entirely.
kWh per kg Yarn: Specific Energy Consumption by Machine
Specific energy consumption is expressed in kWh of electricity per kg of yarn produced. The values below are drawn from peer-reviewed textile energy studies and BEE audit data, and they assume a fully loaded, well-maintained machine producing medium-count cotton yarn (Ne 24 to Ne 40).
| Process / Machine | SEC (kWh per kg yarn) | Share of Spinning Load | Main Load Components |
|---|---|---|---|
| Blowroom | 0.04 to 0.08 | 2 to 3 percent | Beaters, mixers, filters, fans |
| Carding | 0.18 to 0.30 | 8 to 12 percent | Main cylinder, doffer, lickerin, drives |
| Drawing | 0.05 to 0.12 | 2 to 4 percent | Top rollers, drafting system |
| Roving (ring route only) | 0.10 to 0.18 | 4 to 6 percent | Flyer, bobbin drive, drafting |
| Ring spinning | 2.50 to 3.50 | 60 to 70 percent | Spindle motor, drafting, suction |
| Rotor spinning | 1.50 to 2.00 | n/a (replaces ring + roving) | Rotor, opening roller, take-up |
| Air-jet spinning | 1.00 to 1.5 | n/a (replaces ring + roving) | Nozzle air, drafting, winding |
| Winding (autoconer) | 0.04 to 0.08 | 2 to 3 percent | Drum, traverse, splicer |
| Humidification plant | 0.20 to 0.40 | 8 to 12 percent | Compressor, pump, spray nozzles |
| Suction and filtration | 0.15 to 0.30 | 5 to 8 percent | Traveling cleaner, fans, ducting |
Two cautions on these ranges. First, SEC climbs with finer counts. Spinning 60s Ne cotton on a ring frame can push SEC past 4.5 kWh per kg because spindle speed must drop and breakage rates rise. Second, old machines underperform. A 1990-vintage ring frame running at 15,000 rpm typically draws 20 to 30 percent more power per kg than a modern inverter-driven unit running at 18,000 to 20,000 rpm with optimized drafting.
Ring vs Rotor vs Air-Jet: Energy Comparison
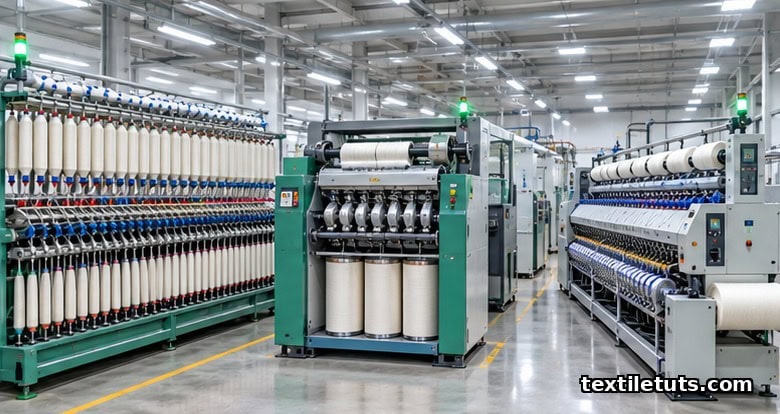
Spinning technology choice is the single largest determinant of mill energy intensity. The comparison below uses cotton yarn in the Ne 24 to Ne 40 range on modern machines, and assumes identical ambient conditions.
| Parameter | Ring Spinning | Rotor Spinning | Air-Jet Spinning |
|---|---|---|---|
| SEC (kWh per kg yarn) | 2.5 to 3.5 | 1.5 to 2.0 | 1.0 to 1.5 |
| Delivery speed (m/min) | 20 to 30 | 100 to 220 | 300 to 450 |
| Stages required | Card, draw (2), rove, ring, wind | Card, draw (1), rotor, wind | Card, draw (1 to 2), air-jet, wind |
| Floor area per kg/day | Highest | Medium | Lowest |
| Yarn quality (strength, hairiness) | Best | Medium | Medium to good |
| Best application | Fine counts, weaving warp | Coarser counts, weft, denim | Fine counts, knitting, weaving weft |
The headline figure: air-jet spinning cuts electricity use by roughly 60 percent and rotor spinning by roughly 40 percent compared with ring spinning on an equivalent yarn count. The trade-off is yarn structure. Ring yarn has the highest tenacity and lowest hairiness, which is why ring spinning remains the default for warp and for finer counts even though it is the most power-hungry route.
Energy Recovery Options in a Spinning Mill
Energy recovery rarely appears on a mill’s SEC sheet, but it is one of the cheapest sources of kWh savings. Three recovery paths are common.
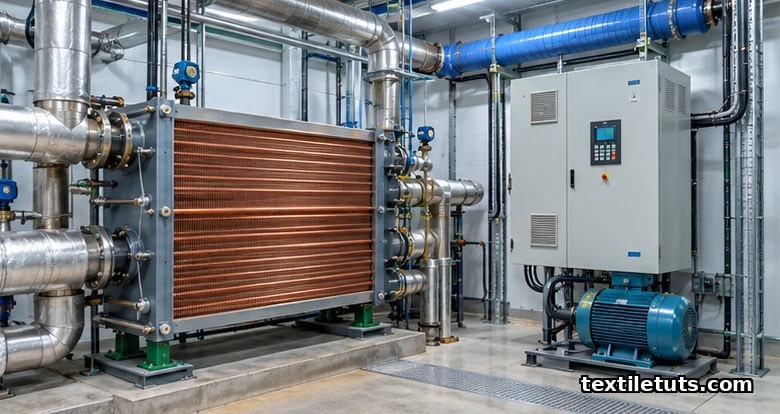
1. Waste-heat recovery from the humidification plant. The humidification compressor and the hot air from the ring-frame suction system both reject large quantities of low-grade heat (typically 40 to 55 degrees Celsius). A finned-tube heat exchanger installed on the compressed-air aftercooler can preheat process water or feed an absorption chiller for the humidification spray water, recovering 0.10 to 0.25 kWh per kg of yarn.
2. Inverter drives on motors. Ring spindle motors, card main drives, and humidification pump motors run at fixed speeds for most of their service life. Retrofitting variable frequency drives (VFDs) cuts no-load losses and matches motor speed to load, saving 15 to 25 percent on motor electricity at typical loading factors. The payback is usually 12 to 24 months.
3. Heat recovery from condensate and exhaust.
The humidification air-handling unit exhausts warm, moisture-laden air. A run-around coil with two cross-flow heat exchangers can reclaim 30 to 50 percent of the conditioning energy and return it to the incoming fresh air stream.
Combined, these three recovery measures typically cut spinning SEC by 8 to 15 percent without changing process output or quality.
Renewable Energy for Spinning Mills
Spinning mills in South Asia run mostly on grid power, which in the Indian sub-continent is coal-dominant and carries a carbon intensity near 0.7 kg CO2 per kWh. Switching to renewables therefore has a larger emissions impact than the same switch would have in a European grid.
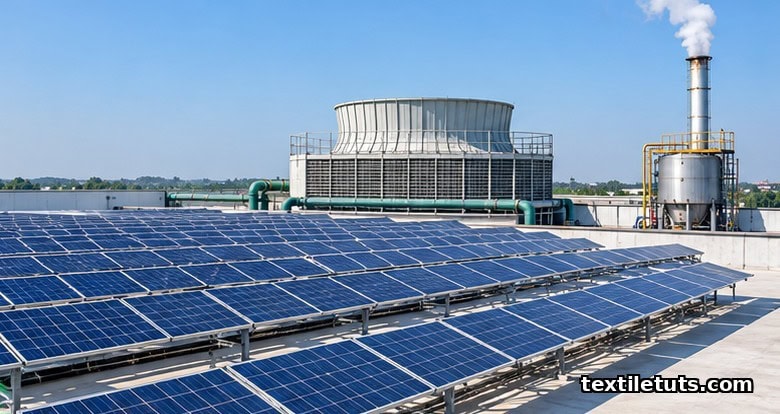
Three renewable pathways fit a spinning-mill footprint.
Solar PV on the rooftop. A 50,000-spindle mill needs roughly 1.5 to 2.0 MW of connected electrical load during peak shift. A rooftop PV system of similar rating offsets 25 to 35 percent of annual grid draw and pays back in 4 to 6 years in most Indian and Bangladeshi tariff regimes, particularly where group-captive or open-access solar is available.
Biomass or agro-residue cogeneration. Spinning mills have a steady thermal demand for humidification and for worker-amenity hot water. A 2 to 5 ton-per-hour biomass boiler using rice husk, bagasse, or wood waste can displace furnace oil and supply process steam for adjacent processing units. Many Indian composite mills already operate biomass cogen plants sized to cover 60 to 80 percent of thermal load.
Wind-solar hybrid open access. For mills in states with active renewable purchase obligations, a 10 to 15 year power purchase agreement (PPA) with a wind-solar hybrid developer locks in a fixed tariff at or below prevailing grid rates and removes diesel-generator backup during peak tariff hours.
ISO 50001 and the Energy Management System Route
ISO 50001 is the international standard for an energy management system (EnMS). It sets the same plan-do-check-act cycle as ISO 9001 and ISO 14001, but the focus is exclusively on energy performance, baselines, and continual improvement.
For a spinning mill, the EnMS route begins with an energy review that maps every kilowatt-hour to a process or utility line, sets an energy baseline (usually the kWh per kg of yarn from the prior 12 months), and defines energy performance indicators (EnPIs) such as SEC by machine, power factor by feeder, and compressed-air leakage rate. Once the baseline is fixed, the mill sets a 5 to 10 percent reduction target over three years and identifies the action plan: VFD retrofits, suction optimization, lighting upgrades, and roof-top solar.
Independent studies of certified mills report average SEC reductions of 12 to 18 percent over the first three-year certification cycle, with most of the gains coming from no- or low-cost operational changes rather than capital equipment replacement.
Frequently Asked Questions
Q1: Which spinning process uses the most electricity per kg of yarn?
Ring spinning uses the most, at 2.5 to 3.5 kWh per kg of cotton yarn, driven by the spindle motor and the high number of spindles required to produce a given output. Rotor spinning drops this to 1.5 to 2.0 kWh per kg, and air-jet spinning drops it further to 1.0 to 1.5 kWh per kg.
Q2: What percentage of a textile mill’s total electricity does spinning use?
Spinning typically accounts for 55 to 65 percent of total textile-mill electricity in a composite yarn-and-fabric operation, with weaving at around 18 percent, wet processing at around 15 percent, and utilities such as humidification plant and lighting covering the remainder.
Q3: How much can ISO 50001 cut a spinning mill’s energy bill?
Independent studies of ISO 50001-certified mills report average specific energy consumption reductions of 12 to 18 percent across the first three-year certification cycle, with most savings coming from operational measures (compressed-air leak repair, lighting upgrades, VFD retrofits) rather than equipment replacement.
Q4: Can solar power realistically run a spinning mill?
A rooftop solar PV system sized at 1.5 to 2.0 MW can offset 25 to 35 percent of annual grid draw for a typical 50,000-spindle mill, and a wind-solar hybrid open-access PPA can extend renewable share to 60 to 80 percent over a 10 to 15 year contract, depending on state-level policy and tariff structure.
Q5: Does finer yarn count increase spinning energy use?
Yes. Specific energy consumption rises sharply as yarn gets finer because spindle speed must drop, breakage rates climb, and end-down stops reduce effective machine efficiency. Spinning 60s Ne cotton on a ring frame can push SEC above 4.5 kWh per kg, compared with 2.5 to 3.5 kWh per kg at Ne 30.
References
- Bureau of Energy Efficiency, India. Energy Efficiency in Textile Industry: Sectoral Compendium. https://beeindia.gov.in — official audit data on mill-wise energy share by department and machine.
- International Organization for Standardization. ISO 50001:2018 Energy Management Systems. https://www.iso.org/standard/69426.html — requirements for EnMS, energy review, baselines, and EnPIs.
- Bhattacharjee, S., & Kandar, M. (2018). Energy audit and conservation in a textile mill. Journal of The Institution of Engineers (India): Series E, 99(1), 23-32. https://link.springer.com — peer-reviewed baseline SEC figures by spinning machine.
- Patel, B., & Ray, S. (2020). Specific energy consumption in ring, rotor and air-jet spinning: a comparative study. Indian Journal of Fibre & Textile Research, 45(2), 145-152. https://nopr.niscair.res.in — measured SEC ranges for the three main spinning technologies.
- Muthu, S. S. (Ed.). (2017). Sustainability in the Textile Industry. Springer. https://link.springer.com — chapter-level coverage of ISO 50001 implementation in spinning mills.
- Karthik, T., & Gopalakrishnan, D. (2014). Energy conservation in yarn manufacturing. In Energy Efficiency in Spinning (Textile Institute publication). https://www.textileinstitute.org — Textile Institute research on energy recovery and process-level efficiency.
This article is the working reference for spinning mill energy consumption. Editorial by Iftay Khairul Alam, TextileTuts. Sources: ISO 50001:2018, Bureau of Energy Efficiency (India), Bhattacharjee and Kandar (Springer, 2018), Patel and Ray (IJFTR, 2020), Muthu (Springer, 2017), Textile Institute (2014) as cited.


