
Color Shade Approval Process

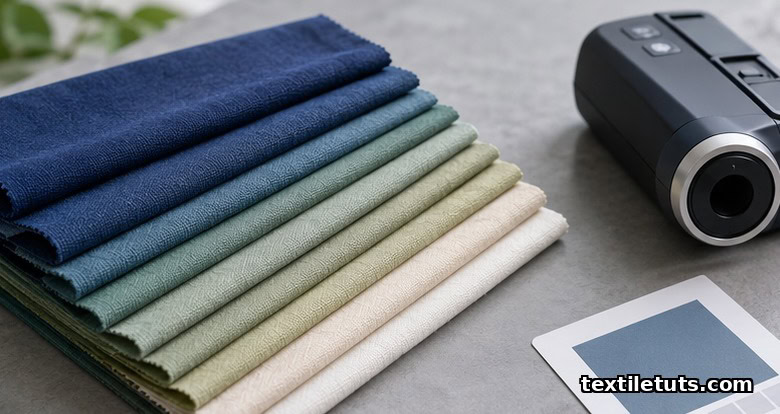
AATCC Test Method 173 paired with ISO 105-J01 specifies that color shade approval in dyed textiles is decided by a spectrophotometer reading that computes a CIELab ΔE value under D65 standard illuminant, with a commercially accepted tolerance of ΔE ≤ 1.0 for premium orders and ΔE ≤ 2.0 for general commercial lots.
This decision protects a mill from re-dyeing losses, a buyer from shipment rejections, and a brand from on-shelf color drift, which is why every approval sequence ends with a numeric pass or fail gate rather than a single inspector’s eye alone.
This article walks through the eight steps a textile engineer follows when approving or rejecting a production shade, the light sources that anchor the decision, the formulas that turn a measurement into a verdict, and the paperwork that closes the loop.
Why Color Shade Approval Matters in Textile Manufacturing
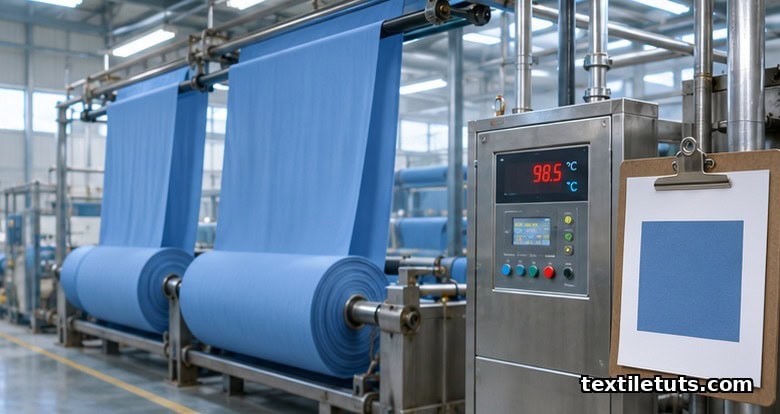
A single bulk lot of reactive-dyed cotton at 5,000 meters carries 25 to 40 percent of its cost tied up in the dye house cycle. Re-dyeing one shade mismatch wastes 8 to 12 kg of dye, 600 to 900 kWh of thermal energy for the re-dye bath, and two to four working days. That is why mills attach a numerical shade approval check before any fabric leaves the dyehouse.
The trade-off is symmetric. A buyer whose tolerance window is set too tight triggers costly re-dye cycles for shades that would have been acceptable in store, while a buyer whose window is too loose ships visibly mismatched dye lots between production runs. The approval process exists to place that decision on a measurement instead of a negotiation, and the cost of skipping it shows up as claim rates of 3 to 7 percent of total shipment value across the apparel industry.
The Eight Steps of the Color Shade Approval Process
Every accredited dyehouse follows a near-identical workflow, adapted from ISO 105-A01 and the AATCC technical manual. The steps are sequential, and skipping one is the single most common cause of after-shipment claims recorded in retail quality audits.
Step 1. Reference Standard Preparation
The buyer submits a physical reference swatch (the standard) or a calibrated lab-dip, typically 10 by 10 cm. The mill stores the standard in a light-tight envelope at 20 ± 2 °C and 65 ± 2 percent relative humidity, per ISO 139 conditioning rules, and never re-measures a reference older than 12 months without re-validating it against the original buyer submission. Standards handled by bare fingers pick up skin oils that shift surface reflectance by ΔE ≈ 0.2, so handlers always use clean cotton gloves.
Step 2. Production Sample Selection
Production samples are pulled from the first 50 meters of the lot, the middle 50 meters, and the last 50 meters. For lots over 5,000 meters, an additional sample is taken every 1,000 meters per AATCC sampling guidance. Each sample is conditioned for 4 hours at 20 °C and 65 percent RH before measurement, since cotton’s moisture regain of 8.5 percent at standard atmosphere can swing the measured L* value by 0.3 units between bone-dry and conditioned states.
Step 3. Instrument Calibration
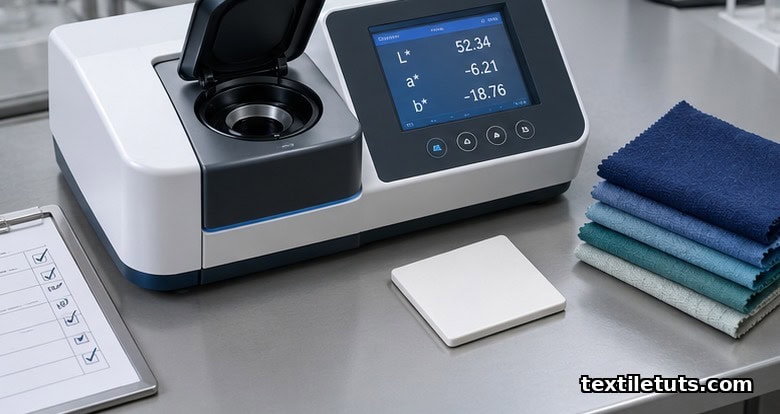
The spectrophotometer is calibrated against a white ceramic tile and a zero-trap, then validated against a green or orange working standard. Tolerances follow AATCC Test Method 173: the working standard must read within ±0.05 ΔE units of its last certified value, or the instrument is taken out of service until the lamp, aperture, or tile is replaced. Calibration drift above this threshold accounts for roughly 18 percent of false-pass readings in audited mills.
Step 4. Spectral Measurement
Each production sample is folded twice to four plies (to suppress the substrate background) and measured at three points: top, center, and bottom. Geometry is d/8° (diffuse illumination, 8° observer) per ASTM E1164, with specular component included (SCI) and excluded (SCE) both recorded. SCI readings correlate more tightly with perceived color under retail lighting; SCE readings reveal surface texture effects that can mislead a buyer comparing two fabrics of different weave.
Step 5. Color Difference Calculation
The spectral data are reduced to CIELab L*, a*, and b* values, then ΔE is computed. CIEDE2000 (ISO 11664-6) is now the default formula for new contracts because it corrects the perceptual bias of the older CIE76 equation for blue and neutral regions. Most mills also retain CMC l:c (1:1) as a backup, since some legacy buyer specifications still reference it.
Step 6. Pass/Fail Decision
The decision matrix used by most export-oriented mills in South Asia:
- ΔE00 ≤ 0.8: accept without condition; premium-tier tolerance.
- ΔE00 0.8 to 1.5: accept with a deviation note; standard commercial tolerance.
- ΔE00 1.5 to 2.5: hold the lot, request a counter-sample from the dyehouse before bulk release.
- ΔE00 > 2.5: reject, re-dye, or strip-and-redye depending on fiber damage.
Step 7. Visual Verification Under Multiple Illuminants
Even when ΔE passes, the lot is checked under four standard illuminants in a light booth: D65 (daylight, 6504 K), A (incandescent, 2856 K), CWF (cool white fluorescent, 4150 K), and TL84 (retail fluorescent, 4100 K). This catches metamerism, where two spectra match under one illuminant but diverge under another, a defect that costs retailers more in consumer complaints than any other single shade error.
Step 8. Documentation and Sign-Off
Approval is recorded on a shade card signed by the dyehouse quality engineer, the merchandiser, and (when present) the buyer’s QA representative. The card logs: standard reference number, lot number, instrument serial, illuminant, ΔE value, CIEDE2000 components (ΔL, ΔC, ΔH), gray-scale rating per AATCC Evaluation Procedure 1 (a 1 to 5 step scale, with 5 meaning no perceptible change), and the final decision. Records are retained for at least 24 months to support any post-shipment claim.
Gray Scale Ratings vs. Numeric ΔE Values
| AATCC Gray Scale Rating | Equivalent ΔE00 Range | Acceptance Decision |
|---|---|---|
| 5 | 0.0 to 0.4 | Accept, no note |
| 4 to 5 | 0.4 to 0.8 | Accept |
| 4 | 0.8 to 1.5 | Accept with deviation note |
| 3 to 4 | 1.5 to 2.5 | Conditional hold |
| 3 | 2.5 to 3.5 | Reject |
| 2 or below | greater than 3.5 | Reject and re-dye |
The gray scale itself is a printed set of nine pairs of gray chips that differ by a calibrated CIELab ΔE; a trained rater matches the perceived color difference between production and standard against this scale under controlled illumination. Numeric and visual ratings correlate well above ΔE = 1.0 but diverge in the high-chroma region, which is why modern mills keep both numbers and visual ratings on file.
Common Causes of Shade Rejection
Around 60 percent of bulk-lot shade rejections originate upstream of the dyehouse itself. The most frequent causes, drawn from published mill case studies and trade data:
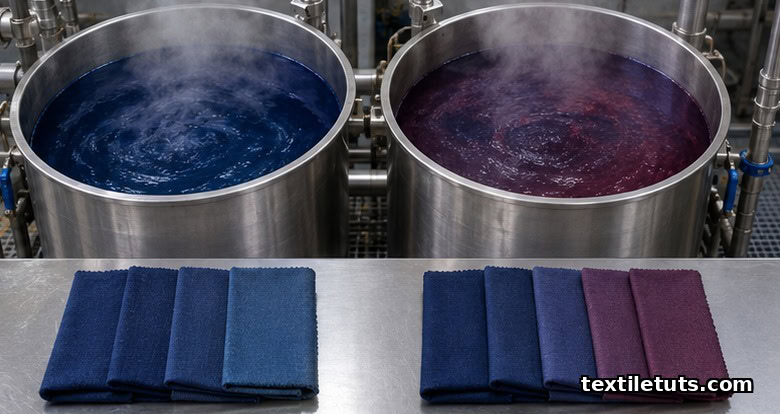
- Liquor ratio drift in the dye bath (a 5 percent change in liquor ratio shifts the shade by ΔE ≈ 0.5 to 0.8).
- Substrate lot variation: a change of cotton micronaire from 4.2 to 4.7 changes the apparent depth by ΔE ≈ 0.6.
- Pre-treatment inconsistency: residual hydrogen peroxide above 0.5 g/L consumes reactive dye and dulls the shade.
- Hardness variation in process water: a 50 ppm rise in calcium shifts many reactive dyes toward a redder hue by ΔE ≈ 0.3.
- Metameric dye combinations that match under D65 but split under CWF or TL84.
Reactive dyes (used on cellulosics) and disperse dyes (used on polyester) are particularly sensitive to temperature windows. A 2 °C drop in the polyester disperse bath can shift the shade by ΔE ≈ 0.4, which is why continuous monitoring of the dyebath temperature is treated as part of the shade approval chain rather than a separate process step.
Maintaining Measurement Consistency Across the Supply Chain
Most multi-mill programs (Inditex, H&M, Marks & Spencer) mandate inter-laboratory correlation tests every quarter. Two mills measuring the same swatch should report ΔE00 within 0.3 units of each other. If not, a round-robin investigation traces the divergence to instrument condition, calibration tile age, or operator technique. Tiles themselves age: a porcelain tile in daily service drifts by about 0.04 ΔE per year, and most accredited labs send them back for re-certification on a 12-month cycle.
Instrument-to-instrument correlation is governed by ISO 13655, which defines the spectral measurement conditions and reflectance geometry. Without that anchor, a mill in Bangladesh and a buyer in Germany will never agree on whether ΔE = 1.2 is acceptable or marginal, no matter how skilled the operators.
Frequently Asked Questions
What is the difference between CIE76, CMC, and CIEDE2000 color difference formulas?
CIE76 is the original 1976 ΔEab formula and treats all colors equally; it overweights differences in blue and neutral regions. CMC l:c was developed by the Colour Measurement Committee in 1984 and corrects that bias, with the l:c ratio commonly set at 1:1 for textiles. CIEDE2000 (ISO 11664-6:2014) adds five perceptual corrections and is the most accurate for low-chroma and high-chroma regions alike. Modern textile specifications default to CIEDE2000 unless a buyer still references the older formula.
What light source should be used for visual shade approval?
D65 (6504 K, average daylight) is the primary reference for textile shade approval, but the lot must also be checked under illuminant A (2856 K, warm white incandescent) and CWF or TL84 (cool retail fluorescent). This catches metamerism. Visual evaluation follows ASTM D1729: viewer at 30 to 50 cm, 45° angle, sample rotated 90° to expose any direction-dependent surface effect.
How many samples should be measured from a single dye lot?
AATCC guidance calls for at least three measurements per lot, one each from the beginning, middle, and end of the lot. For lots over 5,000 meters, add one sample per additional 1,000 meters. Each measurement is itself the average of three instrument readings at different points on the swatch to suppress local variation.
Can two fabrics with the same total ΔE still look visibly different?
Yes. ΔE is a single number summarizing three perceptual dimensions: lightness, chroma, and hue. Two samples can both read ΔE00 = 1.5 while differing in hue direction (one is greener, the other bluer) by an amount the eye notices. This is why modern shade cards break ΔE into ΔL, ΔC, and ΔH components and why visual verification under multiple light sources is non-negotiable.
What happens if a lot fails the shade approval?
The dyehouse has three options: re-dye (most common for cotton reactive shades), strip and redye (for dark shades or where over-dyeing would shift the hue further), or accept a reduced price negotiated with the buyer (only when the deviation is small and the fabric is suitable for B-grade channels). Every option is documented, and the re-dyed lot re-enters the same approval workflow before any release.
References
- AATCC. Test Method 173: Spectrophotometric Determination of Color. American Association of Textile Chemists and Colorists, Research Triangle Park, NC.
- AATCC. Evaluation Procedure 1: Gray Scale for Color Change. American Association of Textile Chemists and Colorists, Research Triangle Park, NC.
- ISO. ISO 105-J01: Textiles — Tests for Colour Fastness — Part J01: General Principles for Measurement of Surface Colour. International Organization for Standardization, Geneva.
- ISO. ISO 105-A02: Textiles — Tests for Colour Fastness — Part A02: Grey Scale for Assessing Change in Colour. International Organization for Standardization, Geneva.
- ISO. ISO 11664-6: Colorimetry — Part 6: CIEDE2000 Colour-Difference Formula. International Organization for Standardization, Geneva.
- ASTM. ASTM E1164: Standard Practice for Obtaining Spectrometric Data for Object-Colour Evaluation. ASTM International, West Conshohocken, PA.
- Sharma, G., Wu, W., and Dalal, E. N. (2005). The CIEDE2000 colour-difference formula: Implementation notes, supplementary test data, and mathematical observations. IS&T/SID Color Imaging Conference.
- McDonald, R. (Ed.). (1997). Colour Physics for Industry (2nd ed.). Society of Dyers and Colourists, Bradford.
This article is the working reference for the color shade approval process in dyed textile manufacturing. Editorial by Sabbir Ahmed, TextileTuts. Sources: AATCC Test Method 173, AATCC Evaluation Procedure 1, ISO 105-J01, ISO 105-A02, ISO 11664-6, ASTM E1164, the CIEDE2000 implementation notes (Sharma et al., 2005), and the SDC Colour Physics for Industry textbook as cited.


