
Carbon Footprint of Textile Manufacturing

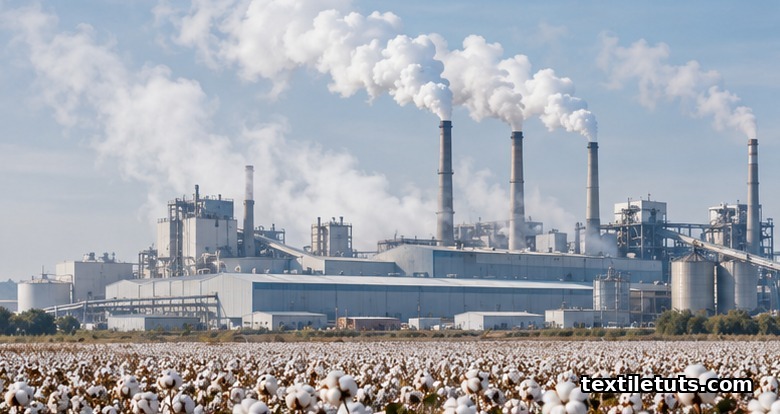
The global textile and apparel industry emits approximately 2.1 billion tonnes of CO2 equivalent per year, accounting for roughly 8 to 10% of global greenhouse gas emissions and exceeding the combined annual emissions of all international flights and maritime shipping.
According to the 2020 Quantis and McKinsey study “Fashion on Climate,” if the industry follows its current trajectory, those emissions could rise to 2.7 billion tonnes by 2030, locking the world past the 1.5°C climate threshold for fashion alone. This article breaks down where textile carbon emissions originate, which fibers carry the lowest impact per kilogram, and what verifiable international standards exist to measure them.
Where Carbon Emissions Originate in the Textile Supply Chain
Textile carbon footprints are not produced in one place. They accumulate across a multi-stage supply chain that stretches from the cotton field or oil refinery, through spinning, weaving, dyeing, and finishing, to the consumer’s washing machine and finally to landfill or incineration. Understanding this distribution is the first step toward credible reduction targets, because interventions placed on the lowest-impact stage yield negligible savings.
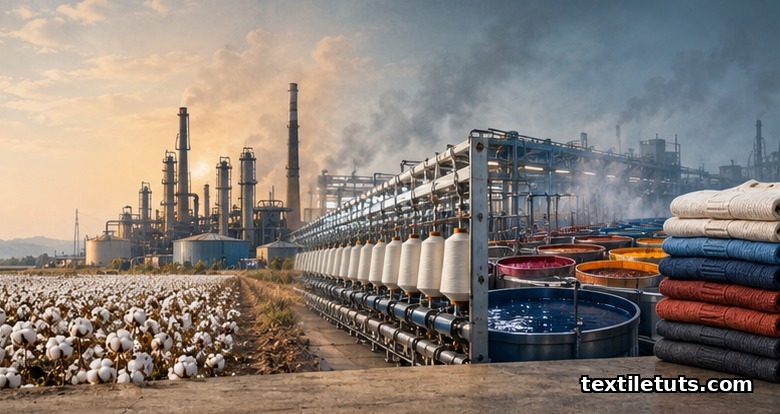
The 2020 carbon footprint study by Lenzen and colleagues, published in Nature, found that raw material production accounts for roughly 56% of textile greenhouse gas emissions. Manufacturing of yarn and fabric accounts for another 22%. Consumer use, primarily washing, drying, and ironing, contributes about 16%. End-of-life treatment accounts for the remaining 6%. These numbers matter because they identify where reductions deliver the largest absolute savings: replacing high-impact fibers, decarbonizing wet-processing steam, and shifting consumer care habits.
Within raw material production, the highest single emitter is polyester manufacturing from fossil feedstock. Each kilogram of virgin polyester carries approximately 3.4 kg of CO2 equivalent emissions, primarily from petroleum refining and polymerization. Cotton production, by contrast, emits between 1.8 and 2.4 kg of CO2 equivalent per kilogram under conventional irrigated cultivation, but its emissions profile differs sharply from polyester because it draws on agricultural inputs such as synthetic fertilizers and irrigation pumps rather than fossil feedstocks.
Fiber-by-Fiber Comparison of CO2 Emissions
Different fibers carry radically different carbon footprints. Research by Sandin, Peters, and Svanström published in Resources, Conservation and Recycling in 2018 compared cradle-to-gate emissions for the major commercial fibers. Polyester and other synthetic fibers derived from fossil fuels consistently rank among the highest emitters per kilogram. Conventional cotton ranks in the middle. Recycled cotton and recycled polyester rank lowest.

Wool sits in a complex position. A kilogram of wool carries between 5 and 10 kg of CO2 equivalent depending on the source study, but this figure includes methane emissions from enteric fermentation in sheep. Without those enteric emissions, wool’s fossil-fuel-derived footprint is comparable to cotton. Polyamide (nylon 6) is the highest emitter among commodity fibers, at roughly 6 kg of CO2 equivalent per kilogram, driven by its energy-intensive caprolactam production and high melt-processing temperatures.
Bio-based alternatives such as lyocell, modal, and bamboo viscose generally produce 0.6 to 1.5 kg of CO2 equivalent per kilogram, particularly when manufactured using closed-loop solvent recovery systems. These numbers are highly dependent on the energy mix of the country of origin: viscose produced in coal-powered grids can exceed the carbon footprint of virgin polyester. Acrylic fiber, often cited as a wool substitute, carries 5.0 to 6.0 kg of CO2 equivalent per kilogram because of its acrylonitrile feedstock. Silk falls in the 4.0 to 6.0 kg range, driven by sericulture heating and reeling energy.
Energy Sources and Manufacturing Hotspots
Within yarn and fabric manufacturing, the largest energy users are wet processing operations: dyeing, finishing, washing, and drying. A 2019 study in the Journal of Cleaner Production found that bleaching and dyeing together account for roughly 36% of a fabric’s carbon footprint when upstream raw material emissions are excluded. Most dyeing operations use fossil-fuel-derived heat, specifically steam from natural gas or coal-fired boilers, to maintain the 80 to 100°C baths required for reactive dyes on cotton.
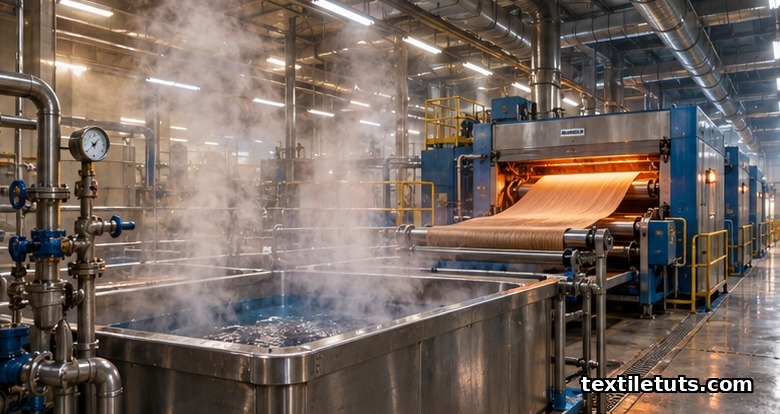
Heat-setting of synthetic fabrics is another major hotspot. Polyester fabric passes through a stenter frame at 180 to 220°C to stabilize dimensions and reduce residual shrinkage. That thermal input alone can add 0.5 to 0.8 kg of CO2 equivalent per kilogram of fabric, depending on whether the heat source is natural gas, coal, or biomass. Switching to renewable thermal energy, geothermal heat, or heat-recovery systems can cut these emissions by 40 to 70%.
Yarn spinning also carries significant emissions, particularly for ring-spun cotton, where spindle motors running above 30,000 RPM consume substantial electricity. Open-end rotor spinning consumes roughly 30% less energy per kilogram of yarn, and air-jet spinning consumes roughly 50% less, though with trade-offs in yarn quality and applicable fiber lengths. Across all spinning systems, the source of grid electricity (coal, natural gas, hydro, or renewables) is the single largest determinant of spinning carbon intensity.
Standards That Measure Textile Carbon Footprints
Several international standards govern how textile carbon footprints are calculated, verified, and reported. Understanding these standards is essential for comparing claims made by different manufacturers, because the system boundaries (cradle-to-gate versus cradle-to-grave) and the emission factors used vary between schemes.
ISO 14067:2018 specifies the principles, requirements, and guidelines for quantifying the carbon footprint of a product. It builds on ISO 14040 and ISO 14044, which govern life cycle assessment broadly. ISO 14067 distinguishes between the “cradle-to-gate” boundary (raw material extraction through factory exit) and the “cradle-to-grave” boundary (including consumer use and end-of-life). For a textile product, these two approaches can yield reported results that differ by a factor of two.
ISO 14064 provides a separate but complementary framework for organizational greenhouse gas accounting at the corporate level. It divides emissions into three scopes: Scope 1 covers direct on-site emissions from boilers and vehicle fleets; Scope 2 covers purchased electricity, steam, and heating; and Scope 3 covers all other indirect emissions, including upstream raw material production and downstream consumer use. For most textile manufacturers, Scope 3 represents over 80% of total emissions, which is why fiber and supplier selection matters more than factory on-site efficiency.
PAS 2050, originally developed by the British Standards Institution, is an older but still widely cited product carbon footprinting standard. It predates ISO 14067 but uses similar methodology and is referenced in many published textile product declarations. The Higg Materials Sustainability Index, published by the Sustainable Apparel Coalition, applies these ISO-aligned methods to textiles specifically, providing comparable emission factors across dozens of fiber types and dozens of countries of origin.
Comparison Table: Carbon Footprint by Fiber Type
| Fiber Type | CO2 Equivalent (kg CO2e per kg fiber) | Primary Emission Driver |
|---|---|---|
| Virgin Polyester | 3.0 to 3.4 | Petroleum refining, polymerization energy |
| Recycled Polyester (rPET) | 0.6 to 1.4 | Sorting, melting, extrusion energy |
| Conventional Cotton | 1.8 to 2.4 | Fertilizer production, irrigation pumping |
| Organic Cotton | 0.9 to 1.2 | Lower fertilizer inputs, lower yields per hectare |
| Nylon 6 | 5.5 to 6.5 | Caprolactam production, high processing temperature |
| Wool (with enteric emissions) | 5.0 to 10.0 | Sheep enteric methane, scouring water heating |
| Acrylic | 5.0 to 6.0 | Acrylonitrile feedstock, polymerization |
| Lyocell (closed-loop) | 0.6 to 0.9 | Solvent recovery efficiency, electricity mix |
| Generic Viscose | 1.0 to 2.5 | Carbon disulfide use, grid carbon intensity |
| Recycled Cotton | 0.2 to 0.6 | Mechanical shredding energy, fiber length loss |
Frequently Asked Questions
How much carbon does one kilogram of cotton produce?
Conventional cotton emits between 1.8 and 2.4 kg of CO2 equivalent per kilogram of finished fiber, depending on irrigation intensity and synthetic fertilizer use. Organic cotton emits 0.9 to 1.2 kg of CO2 equivalent per kilogram, primarily because synthetic nitrogen fertilizer production is the most carbon-intensive farm input. Both figures include emissions from ginning but exclude spinning and downstream processes, so the full lifecycle footprint of a cotton garment is higher than these numbers alone suggest.
What is the largest source of carbon emissions in textile manufacturing?
Raw material production, particularly polyester from fossil feedstocks and cotton from irrigated fields, is the largest single source, accounting for approximately 56% of total industry emissions. Within a single garment, fiber choice typically outweighs every subsequent manufacturing decision combined. After fiber, the second-largest contributor is wet processing (dyeing and finishing), driven by high-temperature steam from natural gas or coal boilers.
Are bio-based fibers always lower-carbon than synthetic fibers?
No. Bio-based fibers can carry higher carbon footprints than synthetic fibers when manufactured in coal-powered grids or when land-use change is involved. Conventional viscose produced in regions with high grid carbon intensity can emit 2.0 kg of CO2 per kilogram, exceeding the cradle-to-gate emissions of recycled polyester. Closed-loop lyocell and recycled cotton are reliably lower-carbon because they combine renewable feedstocks with cleaner processing, but the result depends on the specific factory, country, and energy mix.
How does recycled polyester compare to virgin polyester?
Recycled polyester from PET bottle feedstock reduces carbon emissions by roughly 30 to 60% compared to virgin polyester, depending on whether the facility uses renewable electricity. Research on the carbon footprint of recycled textiles finds that mechanical recycling of PET bottles into staple fiber emits 0.6 to 1.4 kg of CO2 equivalent per kilogram, compared to 3.0 to 3.4 kg for virgin polyester. The savings come primarily from skipping the petroleum refining and naphtha cracking steps.
Can consumers accurately measure the carbon footprint of a single garment?
Not reliably without supply chain data. A garment’s carbon footprint depends on the country of origin for every manufacturing step, the energy mix used in spinning, weaving, and dyeing, the fiber blend ratios, and the expected consumer use phase (washing cycles, drying method, lifetime washes). Published retailer estimates vary widely, often by a factor of three or more, depending on which system boundary was used. Consumers can use the Higg Materials Sustainability Index or any published product carbon footprint statement certified to ISO 14067 as the most credible starting points.
References
- Lenzen, M., Sun, Y.-Y., Faturay, F., Ting, Y.-P., Geschke, A., & Rahman, A. (2020). Mapping the global greenhouse gas emissions of the fashion industry. Nature Reviews Earth & Environment, 1(8), 413-422. This paper quantifies global textile emissions at each supply chain stage and underpins most stage-share figures used in industry reporting.
- Sandin, G., Peters, G., & Svanström, M. (2018). How important is active use in the environmental impact of textile fibers? Resources, Conservation and Recycling, 126, 34-47. This paper presents a peer-reviewed fiber-by-fiber comparison of cradle-to-gate carbon emissions and is widely cited as the methodological baseline for fiber comparisons.
- Muthu, S.S. (Ed.). (2019). Carbon Footprint of Textiles and Textile Products. Singapore: Springer. A book-length synthesis of textile LCA methods, focused on the application of ISO 14040, ISO 14044, and ISO 14067 across fiber, fabric, and garment production.
- International Organization for Standardization. (2018). ISO 14067:2018. Greenhouse gases, Carbon footprint of products, Requirements and guidelines for quantification. Geneva: ISO. This is the product-level carbon footprinting standard used by textile brands publishing per-item footprint claims.
- International Organization for Standardization. (2018). ISO 14064-1:2018. Greenhouse gases, Part 1: Specification with guidance at the organization level for quantification and reporting of greenhouse gas emissions and removals. Geneva: ISO. This is the organizational accounting standard that defines the Scope 1, 2, and 3 emission framework used by textile manufacturers.
- Muthu, S.S., Li, Y., Hu, J.Y., & Mok, P.Y. (2012). Carbon footprint of recycled textile fibers. Science of the Total Environment, 432, 299-307. This paper compares recycled versus virgin fiber emissions under multiple mechanical and chemical recovery pathways.
This article is the working reference for carbon footprint of textile manufacturing. Editorial by Shahrukh Islam, TextileTuts. Sources: Lenzen et al. (2020); Sandin et al. (2018); Muthu (2019); ISO 14067:2018; ISO 14064-1:2018; Muthu et al. (2012), as cited.


